7.2 Checking on a Process
| If a background process takes too long, or you change your mind and want to stop a process, you can check the status of the process and even cancel it. 7.2.1 psWhen you enter the command ps , you can see how long a process has been running, the process ID of the background process, and the terminal from which it was run. The tty program shows the name of the Terminal where it's running; this is especially helpful when you're logged into multiple terminals, as the following code shows: $ ps PID TT STAT TIME COMMAND 347 std S 0:00.17 -bash 391 p2 S+ 0:00.02 -bash $ tty /dev/ttyp1 std corresponds to your current Terminal window, and p2 corresponds to the Terminal window for ttyp2 . In its basic form, ps lists the following:
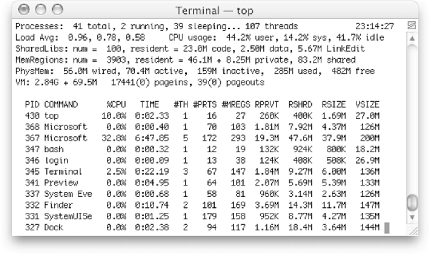
Each terminal window has its own terminal name. The previous code shows processes running on two windows : std and p2 . If you want to see the processes that a certain user is running, type ps -U username , where username is the username of someone logged into the system. To see all processes running on the system, use ps -ax . The -a option shows processes from all users, and the -x option shows processes that are not connected with a Terminal session; many of these are processes that are a core part of Mac OS X, while others may be graphical programs you are running, such as a web browser. Indeed, you can find out what processes are being run as root by using grep and adding a - u flag to get user-oriented output (basically more fields): $ ps -aux grep root head root 408 3.0 0.0 18096 344 std R+ 11:06PM 0:00.02 ps -aux root 87 0.0 0.1 27868 1036 ?? Ss 10:38PM 0:01.26 /usr/ sbin/diskarbitrationd root 89 0.0 0.1 19220 804 ?? Ss 10:38PM 0:00.08 /usr/ sbin/notifyd root 116 0.0 0.0 27472 328 ?? Ss 10:38PM 0:00.28 netinfod -s local root 118 0.0 0.0 18048 112 ?? Ss 10:38PM 0:00.40 update root 121 0.0 0.0 18076 120 ?? Ss 10:38PM 0:00.00 dynamic_ pager -F /private/var/vm/swapf root 139 0.0 0.8 34280 6404 ?? Ss 10:38PM 0:01.40 /System/ Library/CoreServices/coreservi root 161 0.0 0.1 28884 1052 ?? Ss 10:38PM 0:00.18 /System/ Library/CoreServices/SecurityS root 172 0.0 0.1 27744 648 ?? Ss 10:38PM 0:00.20 /usr/ sbin/distnoted root 177 0.0 0.0 27608 184 ?? Ss 10:38PM 0:00.00 cron This is particularly long, so if you want to be fancy, you can add one more command to the pipe to just see the running commands: the awk filtering tool: $ ps -aux grep root awk '{ print ,, }' head root 118 update root 84 kextd root 86 /usr/sbin/configd root 87 /usr/sbin/diskarbitrationd root 89 /usr/sbin/notifyd root 116 netinfod root 121 dynamic_pager root 139 /System/Library/CoreServices/coreservi root 161 /System/Library/CoreServices/SecurityS root 172 /usr/sbin/distnoted $ This command specifies that we are only interested in the first, second, and eleventh fields in the input stream. 7.2.2 topAnother way to see what applications are running and which are taking up the most resources is to use the helpful top command. Figure 7-1 shows the top command in action. Figure 7-1. The top command shows processes running If you're curious what commands consume the most system resources, leave top running in a Terminal window while you work. However, do be aware that the top command itself consumes some system resources, so if you're not paying attention to its output, type q to quit. You can always start it up again if things seem to be oddly slow on your computer. top packs a lot of information into its display, considerably more than we have space to explain here. However, we do have one quick tip: to have processes shown sorted by CPU usage (rather than process ID), use top -o cpu to start the program. We recommend you look at man top for more information. Panther also comes with a very attractive top -like application worth exploring: Applications/Utilities/Activity Monitor .
You can also specify process ID values to ps to find out about specific jobs. Consider the following: $ sort verybigfile > big-sorted-output [1] 522 $ ps 522 PID TT STAT TIME COMMAND 522 std R 0:00.32 sort verybigfile $ ps $$ PID TT STAT TIME COMMAND 347 std S 0:00.35 -bash As the last command shows, you can easily ascertain what command shell you're running at any time by using the $$ shortcut for the process ID of the current shell. Feed $$ to ps , and it'll tell you which shell you're running. You should be aware that there are two types of programs on Unix systems: directly executable programs and interpreted programs . Directly executable programs are written in a programming language such as C, and have been compiled into a binary format that the system can execute directly. Interpreted programs, such as shell and Perl scripts, are sequences of commands that are read by an interpreter program. If you execute an interpreted program, you will see an additional command (such as perl , sh , or csh ) in the ps listing, as well as any Unix commands that the interpreter is executing currently. Shells with job control have a command called jobs that lists background processes started from that shell. As mentioned earlier, there are commands to change the foreground/background status of jobs. There are other job control commands as well. See the references in Section 10.1 in Chapter 10. |
EAN: 2147483647
Pages: 88