| There are a number of different elements that can be styled in a chart, such as line colors, fill colors, fill gradients, alphas, and so on. One place they are often set are for each Series in a chart. As you have seen throughout this lesson, without setting any styles at all, the elements are automatically assigned colors and render. However, if you want more control over the color choices, you can specify Series colors to whatever degree you need. Specifying fill colors for a Series has this structure: <mx:ColumnSeries displayName="net" yField="NET"> <mx:fill> <mx:LinearGradient> <mx:entries> <mx:GradientEntry color="#0000FF" ratio="0" alpha="1"/> <mx:GradientEntry color="#0000DD" ratio=".1" alpha="1"/> <mx:GradientEntry color="#000022" ratio=".9" alpha="1"/> <mx:GradientEntry color="#000000" ratio="1" alpha="1"/> </mx:entries> </mx:LinearGradient> </mx:fill> </mx:ColumnSeries>
Here, you see a four-color gradient fill being applied to a series of columns in a column chart. Notice that a gradient fill takes an array of GradientEntries, each with a color, ratio, and alpha, called entries. In this next exercise, you will apply a gradient fill to the pie chart. | | 1. | Open TypeChart.mxml from your flexGrocer/views/dashboard directory.
Alternately, you can open TypeChart_interpolate.mxml from the intermediate directory and save it as TypeChart.mxml in your flexGrocer/views/dashboard directory.
| 2. | Between the open and close <mx:PieSeries> tags, add an <mx:fills> tag.
<mx:PieSeries field="{grossOrNet}" labelPosition="insideWithCallout" labelFunction="renderLabel" showDataEffect="interpolate" > <mx:fills> </mx:fills> ... </mx:PieSeries>
In the next step, you will specify six different gradients to use for the data in the pie chart.
| | | 3. | Inside the <mx:fills> tags you just created, specify six radial gradients, each with two colors. The first has a ratio of 0, and the second has a ratio of 1, as indicated in the following table.
First Color | First Color Ratio | Second Color | Second Color Ratio |
|---|
#EF7651 | 0 | #994C34 | 1 | #E9C836 | 0 | #AA9127 | 1 | #6FB35F | 0 | #497B54 | 1 | #A1AECF | 0 | #47447A | 1 | #996666 | 0 | #999966 | 1 | #339933 | 0 | #339999 | 1 |
<mx:fills> <mx:RadialGradient> <mx:entries> <mx:GradientEntry color="#EF7651" ratio="0"/> <mx:GradientEntry color="#994C34" ratio="1"/> </mx:entries> </mx:RadialGradient> <mx:RadialGradient> <mx:entries> <mx:GradientEntry color="#E9C836" ratio="0"/> <mx:GradientEntry color="#AA9127" ratio="1"/> </mx:entries> </mx:RadialGradient> <mx:RadialGradient> <mx:entries> <mx:GradientEntry color="#6FB35F" ratio="0"/> <mx:GradientEntry color="#497B54" ratio="1"/> </mx:entries> </mx:RadialGradient> <mx:RadialGradient> <mx:entries> <mx:GradientEntry color="#A1AECF" ratio="0"/> <mx:GradientEntry color="#47447A" ratio="1"/> </mx:entries> </mx:RadialGradient> <mx:RadialGradient> <mx:entries> <mx:GradientEntry color="#996666" ratio="0"/> <mx:GradientEntry color="#999966" ratio="1"/> </mx:entries> </mx:RadialGradient> <mx:RadialGradient> <mx:entries> <mx:GradientEntry color="#339933" ratio="0"/> <mx:GradientEntry color="#339999" ratio="1"/> </mx:entries> </mx:RadialGradient> </mx:fills>
Feel free to experiment and find colors that work best for you. You can add as many colors to the array as you want. Experiment switching between radial gradients and linear gradients to get a feel for how they each work.
| 4. | Save and run the application.
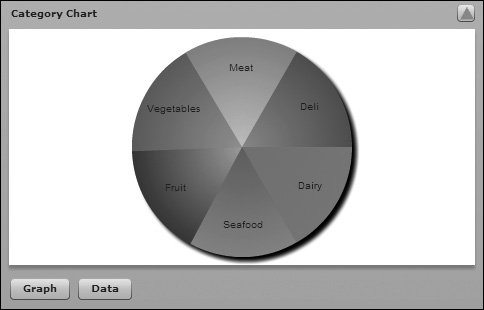
Notice the subtle gradient in each slice of the pie.
|
|