Using events, you will make your charts more interactive.
1. | Open SalesChart.mxml from your flexGrocer/views/dashboard directory.
Alternately, you can open SalesChart_labelFunction.mxml from the intermediate directory and save it as SalesChart.mxml in your flexGrocer/views/dashboard directory.
|
2. | Set the showDataTips attribute of the <mx:LineChart> tag to true and specify the dataTipFunction attribute equal to renderTips.
<mx:LineChart dataProvider="{dp}" height="100%" width="100%" showDataTips="true" dataTipFunction="renderTips" >
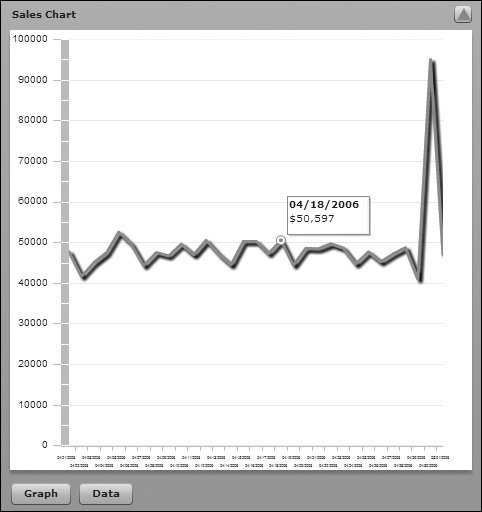
This tells the chart to show data tips when any element is moused over and to use the function renderTips() to determine what to show. You create renderTips() in the next step.
|
3. | In the <mx:Script> block, create a function named renderTips(), which takes a single argument, called hd of type HitData, and returns a String.
private function renderTips(hd:HitData):String { var item:Object = hd.item; return "<b>"+mmddyyyy.format(item.DTSALE)+"</b><br>" + dollars.format(item[grossOrNet]); }
If you use the code completion feature, the import for HitData will automatically be added; otherwise, you will need to explicitly add it.
|
| |
4. | Save and test the application.
Notice that as you mouse over elements in the line chart, nicely formatted data tips are now available. The completed file should look like SalesChart_dataTips.mxml in the intermediate directory.
|
5. | Open TypeChart.mxml from your flexGrocer/views/dashboard directory.
Alternately, you can open TypeChart_labels.mxml from the intermediate directory and save it as TypeChart.mxml in your flexGrocer/views/dashboard directory.
|
6. | Set the showDataTips attribute of the <mx:PieChart> tag to true; specify the dataTipFunction attribute equal to renderTips().
<mx:PieChart dataProvider="{dp}" height="100%" width="100%" showDataTips="true" dataTipFunction="renderTips" >
You create renderTips() in the next step.
|
| |
7. | In the <mx:Script> block, create a function named renderTips(), which takes a single argument, called data of type HitData, and returns a String.
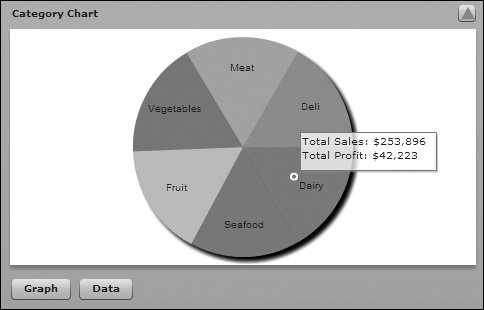
[View full width] private function renderTips(data:HitData):String{ var gross:Number = data.item.GROSS; var net:Number = data.item.NET; return "Total Sales: " + dollars.format(gross)+ '\n' + "Total Profit: " + dollars.format  (net); } (net); }
Remember, you may need to explicitly import the mx.charts.HitData class, unless it was automatically imported for you.
Here, the renderTips() function takes a HitData object, finds the value for the gross and net properties, and builds a string formatting them before returning it.
|
8. | Save and test the application.
Notice that as you mouse over elements in the pie chart, nicely formatted data tips are now available. Next you will react to click events in the pie chart.
|
9. | In the <mx:PieChart> tag, specify an itemClick attribute to call a function named broadcastTypeChange() and pass it event.hitData.item as an argument.
<mx:PieChart width="100%" height="100%" dataProvider="{dp}" showDataTips="true" dataTipFunction="renderTip" itemClick="broadcastTypeChange(event.hitData.item)" >
itemClick is invoked when the user clicks an item in the chart. When this happens, a ChartItemEvent object is created, which has a property called hitData. The hitData property is an object describing the click. The item property of hitData contains a reference to the item on which the user clicked. In the next step, you will write the broadcastTypeChange() function, so an event is dispatched back to the main application when the user clicks a category on this chart.
|
| |
10. | In the <mx:Script> block, create a function called broadcastTypeChange(), which takes an argument called item of type Object, and returns void. This function will create an instance of the ObjectDataEvent class and dispatch it.
private function broadcastTypeChange(item:Object):void{ var o:ObjectDataEvent= new ObjectDataEvent("typeChange", item.CATEGORY); this.dispatchEvent(o); }
ObjectDataEvent is an event written earlier, which has a custom property called data that is of type Object.
|
11. | Declare an event named typeChange of type events.ObjectDataEvent in an <mx:MetaData> tag at the top of the TypeChart.mxml component.
<v:MaxRestorePanel xmlns:mx="http://www.adobe.com/2006/mxml" xmlns:v="views.*"> <mx:Metadata> [Event(name="typeChange", type="events.ObjectDataEvent")] </mx:Metadata> ... </v:MaxRestorePanel>
|
12. | Save TypeChart.mxml.
You need to make a change to Dashboard.mxml before you can test this latest change. TypeChart.mxml should now resemble TypeChart_events.mxml in the intermediate directory.
|
13. | Open Dashboard.mxml from your flexGrocer directory.
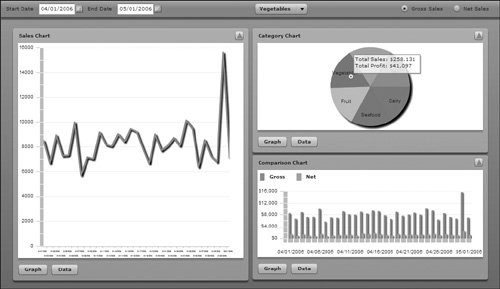
This is the application that instantiates all three charts.
|
14. | Find where TypeChart is instantiated. Add an attribute to handle the typeChange event and call a soon-to-be-written function called doTypeChange().
<v:TypeChart width="100%" height="100%" title="Sales By Type" grossOrNet="{grossOrNet}" typeChange="doTypeChange(event)" maximize="this.currentState='fullType'" restore="this.currentState=''"/>
When TypeChart dispatches a type change, you want the rest of the application to react and update itself accordingly.
|
| |
15. | In the <mx:Script> block, create a function called doTypeChange(), which takes an argument of type ObjectDataEvent. This function should use the Util classes static presetCombo() method to set the ComboBox control in the ApplicationControlBar container. Next, the selectedType property should be set to event.data.toString(). Finally, the function should send the dashboardWS.getSalesData web service.
private function doTypeChange(event:ObjectDataEvent):void{ Util.presetCombo(catCombo,"name",event.data.toString()); selectedType = event.data.toString(); dashboardWS.getSalesData.send(); }
When a ObjectDataEvent is broadcast, you want to have the ApplicationControlBar reflect the currently selected type, so you can use the presetCombo() function you saw earlier. If you recall from Lesson 17, "Accessing Server-side Objects," the getSalesData web service method takes three arguments: startDate, endDate, and selectedType. So the service will return the right data, you will first set selectedType and then send the service.
Don't forget, both the utils.Util and events.ObjectDataEvent classes need to be imported.
|
16. | Save and run the application.
After the charts are drawn, if you click a slice of the pie in the type chart, the ComboBox is updated, and new data is loaded from the server, showing only the sales for that type of product.
 |