Section 5.2. DIAGRAMS
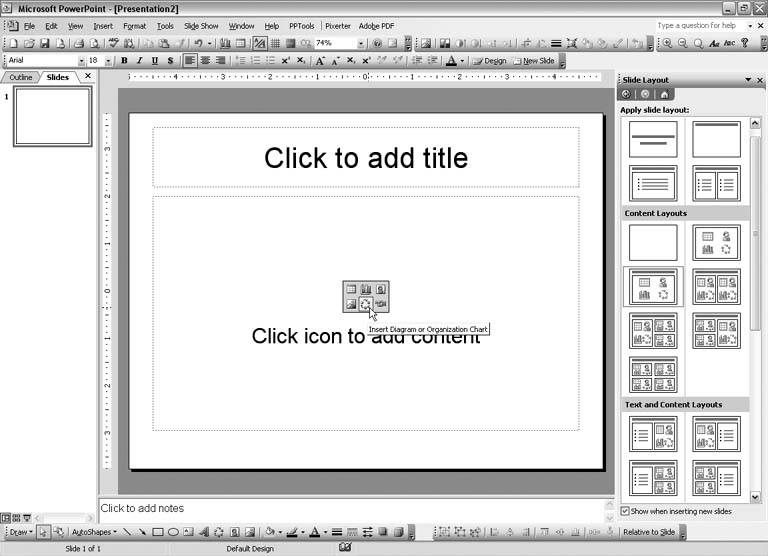
5.1. ORGANIZATION CHARTS5.1.1. Edit Existing Org ChartsTHE ANNOYANCE: I have a bunch of organization charts in an old PowerPoint file. I'm now using PowerPoint 2003, and when I try to edit the org charts, I get an error message that says "server application, source file, or item can't be found." How can I edit these org charts? THE FIX: PowerPoint 2002 and 2003 use a new diagramming applet to create org charts rather than relying on the OLE Organization Chart objects PowerPoint 97 and 2000 used. This error message just means that Organization Chart 2.0 isn't available, so PowerPoint can't edit the organization chart. You need to download and install Organization Chart 2.0 (http://support.microsoft.com/default.aspx?scid=kb;en-us;826835), which lets you edit old-style organization charts in your PowerPoint files. Installing Organization Chart 2.0 also lets you create more "old-style" org charts in PowerPoint 2002 and 2003 by selecting Insert Alternatively, you can ungroup an existing org chart (Draw Figure 5-1. PowerPoint's drawing tools include smart connectors, which gives you another option for creating and editing organization charts and other diagrams. Smart connectors "lock" their ends to other AutoShapes.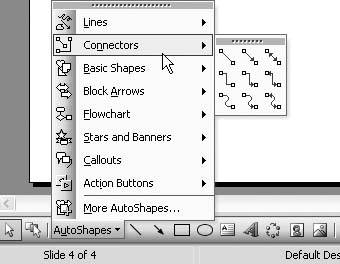 If you see this particular "server not found" error when you attempt to create or edit an org chart in PowerPoint 97 or 2000, the issue is probably the Norton AntiVirus Office Plug-In. It wreaks havoc with OLE embedded objects (usually graphs, tables, and org charts) in Office files. If you double-click a graph or an org chart on your slide and see the "server not found" error, you should disable the Norton Office Plug-In. (Don't worry, you'll still be protected by Norton's regular email and file scanning processes.) To disable the Norton Office Plug-in, close all Office programs and open Norton AntiVirus. Click on Options, and in the left pane, click on Miscellaneous. In the right pane, uncheck Enable Office Plug-in under "How to keep Microsoft Office documents protected." 5.1.2. Out-of-Memory ErrorsTHE ANNOYANCE: I'm trying to add an organization chart on my slide in PowerPoint 97, but I keep getting an error message that says I'm out of memory. I have tons of memory on this system, so what's the problem? THE FIX: Believe it or not, having too many fonts installed on your system causes this error message in Org Chart 2.0: "There isn't enough memory available to read MS Org Chart." Move some of your fonts out of your C:\Windows\Fonts folder. This effectively uninstalls them and should fix the error you're seeing with Organization Chart.
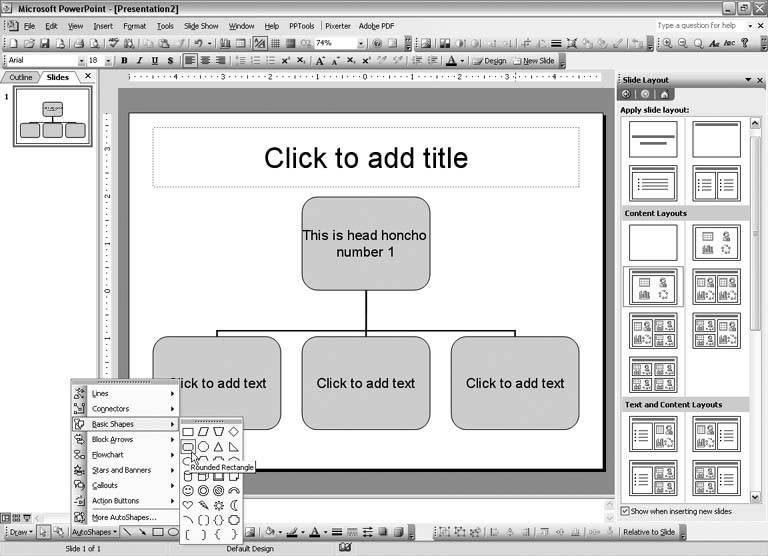
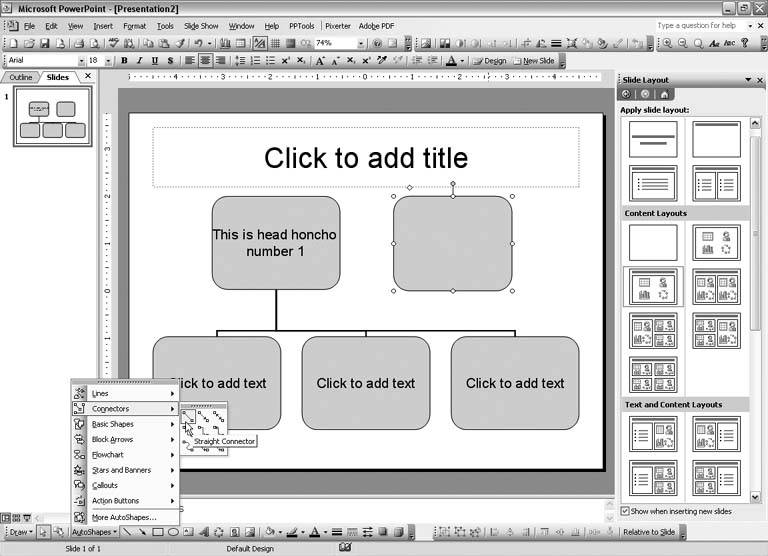
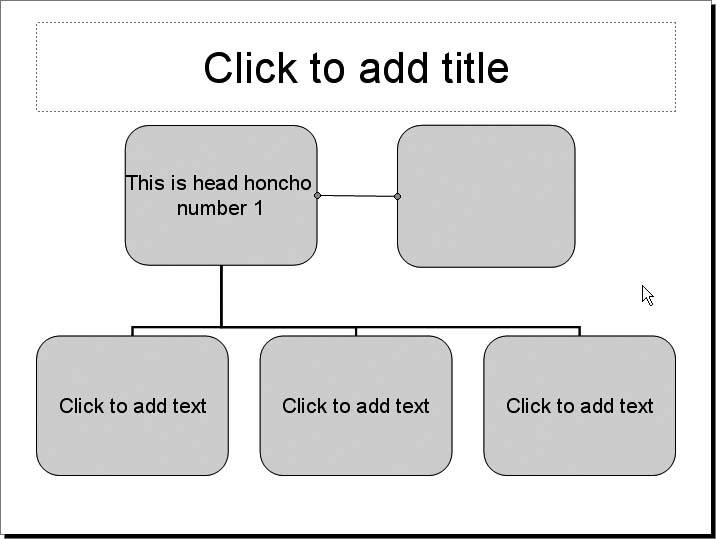
There's no magic number of fonts that will clear the error. Usually 500 or more will cause the error, but sometimes you'll see the error with as few as 300 fonts. Just keep moving them out of the folder a few at a time until Org Chart starts working again. However, make sure you keep the fonts Office and other programs rely on to run properly. These include Arial, Courier New, Marlett, Symbol, Times New Roman, Tahoma, and WingDings. Fonts use up memory, so you're generally better off not having too many installed at once. To be on the safe side, move the fonts to another folder on your computer so you can reinstall them when you're ready to use them. 5.1.3. Add More Lines to a Box in an Org ChartTHE ANNOYANCE: Some of the people in my organization have really long titles, so I need more than four lines in the organization chart boxes in PowerPoint 2000. Is there a way I can do this? THE FIX: Select one of the subordinate boxes and click the Elongated Box on the Styles menu (see Figure 5-2). Click the Subordinate icon, and then click on the elongated box (see Figure 5-3). Click the new subordinate box again and drag it to the elongated box just above. Make sure the white directional arrow appears before you let go (see Figure 5-4). Figure 5-2. Click the Elongated Box style to begin adding more lines to a box in an organization chart.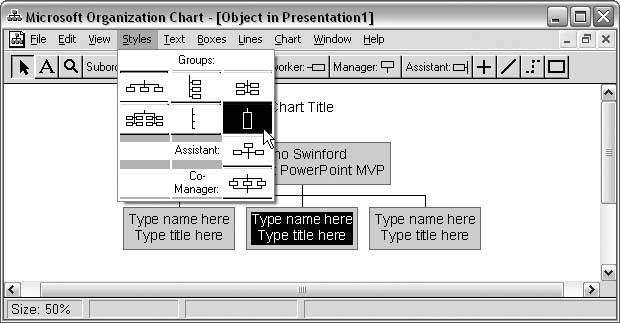 Figure 5-3. Click the Subordinate icon and then click on a box in the window to add subordinates.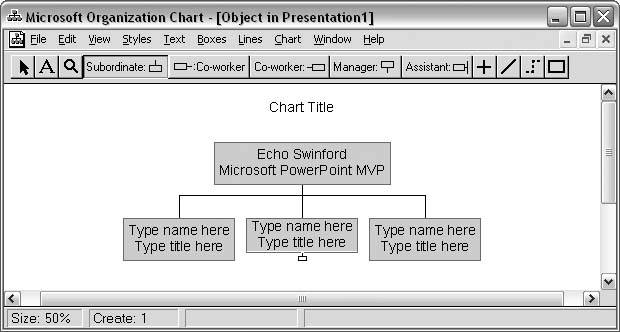 Figure 5-4. Click and drag the subordinate into the upper part of the elongated box to finish adding more lines to a box.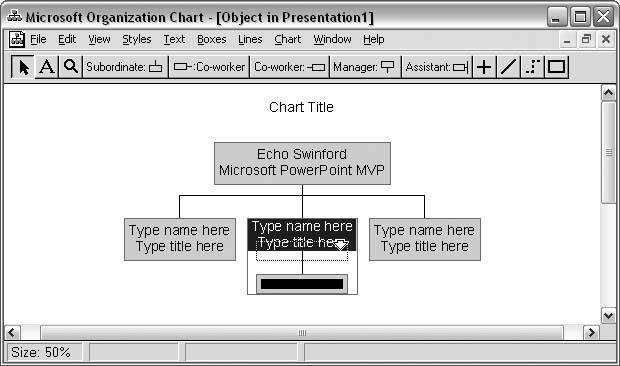 5.1.4. Add Another Head HonchoTHE ANNOYANCE: I need to add more than one boss to the top of an org chart in PowerPoint 2002, but I can't figure out how to do it. THE FIX: In PowerPoint 97 or 2000, you'll have to use PowerPoint's AutoShapes and connectors to draw the org chart on the slide because there's no way to have two bosses in an Organization Chart 2.0 object. Or, you can create the org chart with only one boss and select Draw In PowerPoint 2002 and 2003, it's a bit more complicated. To add another box to the top level in the organization chart, follow these steps:
Figure 5-10. Use the yellow diamonds to change dimensions on certain AutoShapes, including connectors.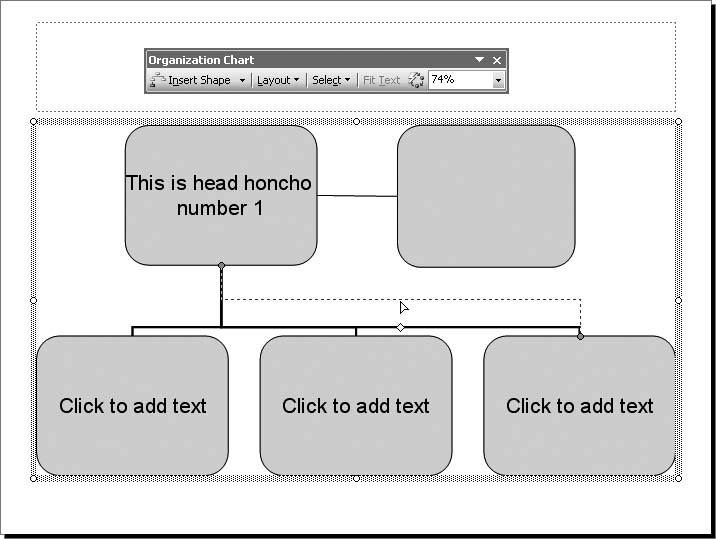 Figure 5-11. If you delete a connector in an organization chart, its associated AutoShape will disappear as well. To hide the connector, choose the "No Line" option on the Colors and Lines tab of the Format AutoShape dialog box.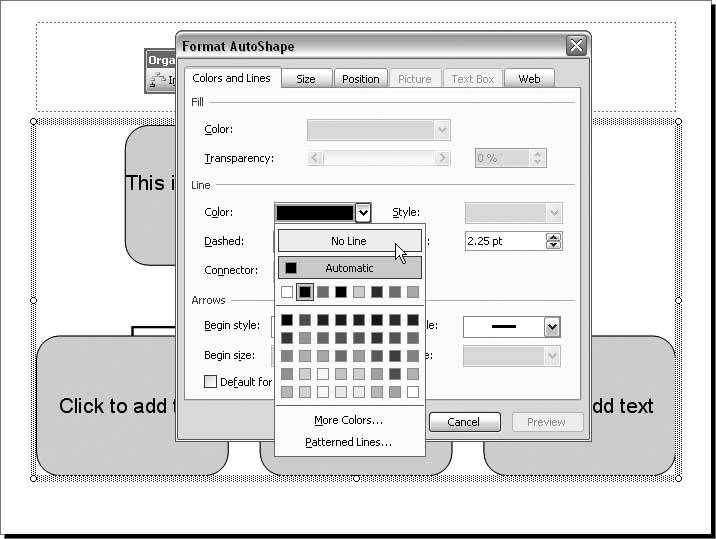 5.1.5. Organization Chart Exceeds LimitTHE ANNOYANCE: While editing an organization chart in PowerPoint 97, I got the following error message: "Your chart would exceed the MS Organization Chart size limit (22x17 inches)." Huh? THE FIX: Amazingly, this error message actually means what it says: you've exceeded the maximum allowable size for Organization Chart objects. The error sometimes occurs because of the font size used in the organization chart. Try decreasing the font size in the chart to see if it resolves the error message. If not, create two smaller organization charts, place them side by side on the slide, and use PowerPoint's drawing tools to connect the two as necessary. |
 Object
  Ungroup) and edit it using PowerPoints AutoShapes and smart connectors on the Drawing toolbar (see Figure 5-1). Ungrouping an organization chart turns it into PowerPoint drawing objects, so you don't need Organization Chart 2.0 to manipulate the individual pieces.
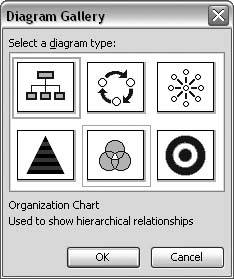
EAN: 2147483647
Pages: 83