| Objective: Monitor network traffic. Tools might include Network Monitor and System Monitor. As a network administrator, you will find that network traffic can directly influence your productivity and design of a network. You need to implement a solid plan to monitor existing traffic and then deduce how to manage that traffic. Your constant battle will be that when you add a new service, you will also lose a percentage of your available bandwidth. Fortunately, through planning, tweaking, and design, you can keep those lost percentages small. Using the Network Monitor Network traffic is any activity directed to or from a host on a network. Any packet that leaves a network card is contributing to network traffic. Network traffic increases with more hosts and more services. In addition, when a network is not segmented properly, network traffic increases as well. Why is the issue of network traffic so important? A crowded network, like rush-hour traffic, clogs the speed of the network, causes the network to become a bottleneck, and can ultimately cause a network to fail. As a rule, the more you add network services, shares, and resources, the more network traffic you generate. You can use lots of tools and third-party add-ons to monitor your network's activity. However, one tool is more powerful than any piece of software: your brain! If you plan your networks before you implement them, you'll be happier in the long run. The following are a few tips for designing a network while keeping traffic in mind: Get rid of unneeded protocols. Get rid of unneeded services. Organize your shares to create a swift and easy-to-navigate structure. Don't be afraid to segment a network. The more users there are in an environment, the more chatterand contentionthe network experiences. You can segment a network in various ways, such as by using routers and/or switches. Use Network Monitor to create a baseline of network activity. Use this baseline to determine how the network is evolving.
You can use Network Monitor to capture packets on a network. From these packets, you can troubleshoot network problems, discern how busy your network is, and predict how the network will grow. Network Monitor is made up of two primary components: Network Monitor Network Monitor is the tool you use to capture packets sent to and from a server. The version of Network Monitor that is included with Windows Server 2003 records only packets sent to and from the server it is running on and the LAN. Network Monitor driver The Network Monitor driver is installed automatically when you install Network Monitor on a server. If you have Systems Management Server (SMS) installed in your network, you can install the Network Monitor driver on additional computers to allow monitoring of more of your network. However, if you do install the Network Monitor driver on additional computers, you should make a point to install it only once per subnet.
Exam Alert: Beware the Limitations of the Network Monitor When taking this exam, be sure to remember the limitations of the Network Monitor. Also, pay careful attention to where you opt to deploy the Network Monitor driver on other computers.
Installing Network Monitor Network Monitor is not installed by default, but it's easy enough to add. Step by Step 9.1 walks you through the steps to install Network Monitor. Step By Step 9.1. Installing the Network Monitor 1. | Select Start, Settings, Control Panel, Add or Remove Programs.
| 2. | Click the Add/Remove Windows Components button. The Windows Components Wizard dialog box opens, as shown in Figure 9.1.
Figure 9.1. The Network Monitor components are listed under the Management and Monitoring Tools group. 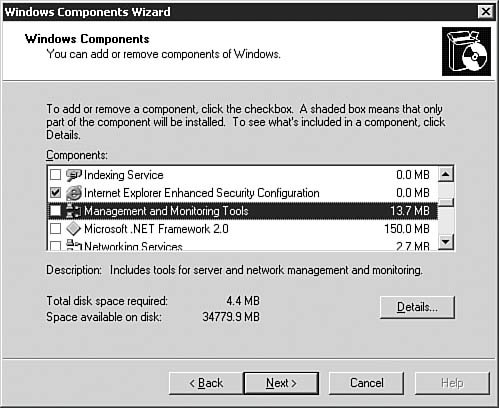
| 3. | Scroll down the list and select Management and Monitoring Tools by double-clicking it. The Management and Monitoring Tools dialog box, shown in Figure 9.2, opens.
Figure 9.2. You can select the Network Monitor Tools option to install the Network Monitor. 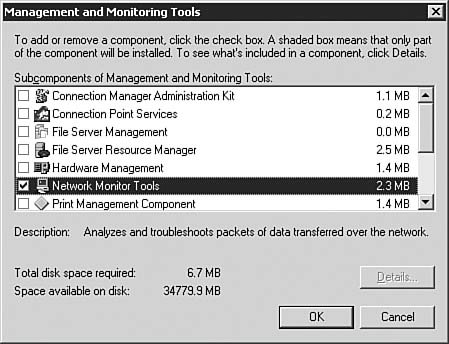
| | | 4. | Select the Network Monitor Tools option in the subcomponents list, click OK, and then click Next.
| 5. | If asked to do so, provide your Windows Server 2003 CD or type a path for accessing the setup files.
| 6. | Click Finish when prompted to complete the Windows Components Wizard.
|
Installing the Network Monitor Driver If you need to monitor a different subnet than the one on which you have installed the Network Monitor or you need to support installation of SMS on a network, you need to add the Network Monitor driver. Step by Step 9.2 guides you through the process of adding only the driver. Step By Step 9.2. Adding the Network Monitor Driver 1. | Open the Network Connections window by selecting Start, Settings, Network Connections.
| 2. | Double-click the Local Area Connection icon to bring up the Local Area Connection Status dialog box.
| 3. | Click the Properties button to open the Local Area Connection Properties dialog box.
| 4. | On the General tab, click the Install button.
| 5. | Choose Protocol from the list of available components and then click Add.
| 6. | Select Network Monitor Driver and click OK. The necessary files are added.
| 7. | If asked to do so, provide your Windows Server 2003 CD or type a path for accessing the setup files.
|
Using Network Monitor to Capture Data Network Monitor, shown in Figure 9.3, captures frames, or packets, to and from the local computer and the network. Step by Step 9.3 walks you through the process of using Network Monitor and creating a simple capture. Later, we go into greater detail on creating a capture filter through Network Monitor. Figure 9.3. The Network Monitor has four panes that display information about network traffic. 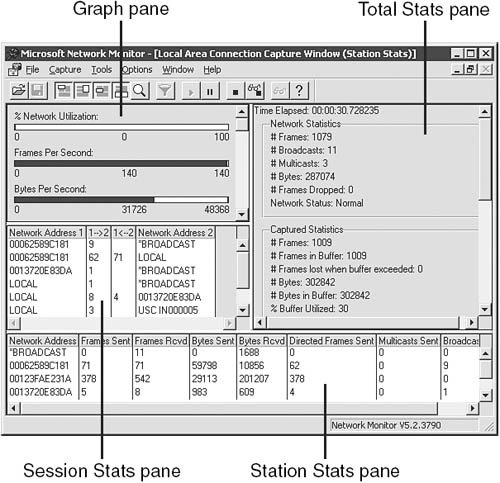
The four panes in Network Monitor report information about the current network activity or captured file: Graph pane The Graph pane reports percentages of activity in bar chart format. Session Stats pane The Session Stats pane reports individual statistics of client-to-server activity during a capture or live activity. Station Stats pane The Station Stats pane reports information on each workstation's activity on a network. Keep in mind that this is actually activity between the specific workstation and the server on which Network Monitor is installed. Total Stats pane The Total Stats pane reports the totals of the stats for all other panes.
Now that you have seen how the captured data will be displayed to you, you can create your first network capture, as outlined in Step by Step 9.3. Step By Step 9.3. Creating a Network Capture 1. | Select Start, Programs, Administrative Tools, Network Monitor. The Network Monitor window opens. If you are prompted to do so, select the network to be monitored.
| 2. | Select Capture, Start to begin the capture session. Network Monitor records activity to and from this computer. You can generate some activity by sending a ping command or browsing the Internet.
| | | 3. | Select Capture, Stop and View to examine the results of the network data capture. Figure 9.4 shows an example of captured network data.
Figure 9.4. All network data that has been captured is listed sequentially. 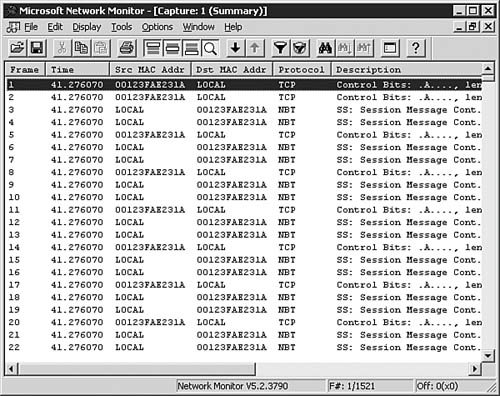
| | | 4. | Double-click any packet to examine it in greater detail, as shown in Figure 9.5. You can scroll through the list in the Summary pane and click any packet you want to examine in the Detail and Hex panes.
Figure 9.5. You can examine each packet captured during a network capture. 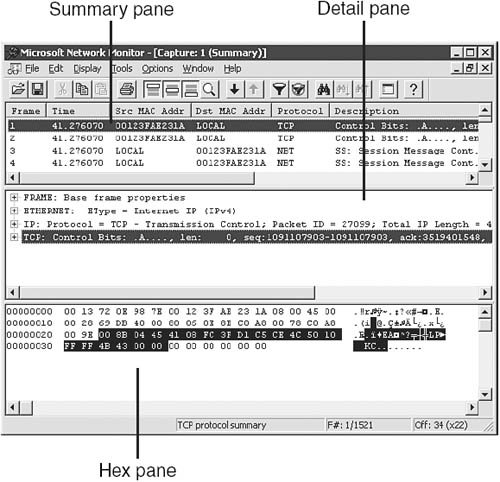
| 5. | Close the Display window to return to the Network Statistics window.
|
Running Network Monitor from the Command Line Like most other configuration and management tools in Windows Server 2003, you can run the Network Monitor from the command line. This is a more difficult and advanced method of performing captures, but it lets you script commands to be executed on multiple computers with little effort. The basic syntax of using the Network Monitor (netmon) from the command line is presented here and explained in more detail in Table 9.1: Table 9.1. netmon Command-Line SwitchesSwitch | Description |
|---|
/net Number | Allows you to specify the number of the network from which you want to capture data. You can specify any network segment to which the computer is connected. | /capturefilter Path | Allows you to specify a saved capture filter to be used. Can be abbreviated as /cfPath. | /displayfilter Path | Allows you to specify a display filter to be used. Can be abbreviated as /dfPath. | /buffersize Number | Allows you to specify the size (in megabytes) of the capture buffer. | /quickfilter {ATM | ETHERNET |IP | IPX |VINES| TOKENRING | FDDI}, Address | Specifies that only frames of a particular type and from a particular address should be captured. You are allowed to specify up to three types at one time. Can be abbreviated as /qf {ATM | ETHERNET | IP | IPX | VINES | TOKENRING | FDDI}, Address. | /quickfiltername FilterName | Allows you to specify the name of the filter you use with the /quickfilter command. Can be abbreviated as /qfn FilterName and is not used if no /quickfilter options are specified. | /autostart | Instructs Network Monitor to begin capturing data at interface startup. | /autostop | Instructs Network Monitor to stop capturing data when the capture buffer is full. |
[View full width] start netmon [/net Number] [/capturefilter Path][/displayfilter Path] [/buffersize Number]  [/quickfilter {ATM | ETHERNET | IP | IPX | VINES | TOKENRING | FDDI}, Address] [/ quickfiltername FilterName] [/autostart] [/autostop] [/quickfilter {ATM | ETHERNET | IP | IPX | VINES | TOKENRING | FDDI}, Address] [/ quickfiltername FilterName] [/autostart] [/autostop]
Interpreting Captured Data How you interpret captured data depends on the type of server with which you're working. What is the server's role in the domain? Is it a Domain Controller? An application server? A file server? Each of these roles has different traffic patterns. You need a filter to get an accurate picture of the activity for a server. Filters allow you to strip away packets that may not be relevant to the server, capture, or packets types for which you're looking. Within Network Monitor, you choose Capture, Filter and the Capture Filter dialog box appears, as shown in Figure 9.6. The Capture Filter dialog box allows you to do the following: Figure 9.6. You can filter out unwanted packets by creating capture filters. 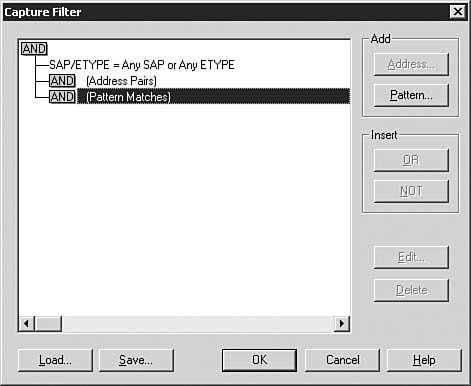
Specify capture filter protocols You can designate which protocols you'd like displayed in the capture. You complete the SAP/ETYPE= field by designating the protocol(s) you'd like displayed. Specify address pairs You can choose up to three pairs of addresses that have sent and received packets from each other. Specify frame data patterns to capture You can build your own variables to display captured data. You can display frames that contain a designated pattern.
Step by Step 9.4 walks you through the steps for configuring filtering for a capture before you start the capture. The advantage of using this method is that it cuts down on the amount of captured data. The disadvantage is that it captures only the type of traffic for which you are filtering. Step By Step 9.4. Configuring Capture Filters Before a Capture 1. | Select Capture, Filter to open the Capture Filter dialog box, which is shown in Figure 9.6.
| | | 2. | Click the SAP/ETYPE= line and then click the Edit button to open the Configure Filter SAPs and ETYPEs dialog box, which is shown in Figure 9.7. Typical options might include IP or NetWare. By default, all items are enabled. You might want to click Disable All and then enable the specific items for which you are looking. When you are done, click OK.
Figure 9.7. You start out by configuring the SAPs and ETYPEs for which you want to see capture data. 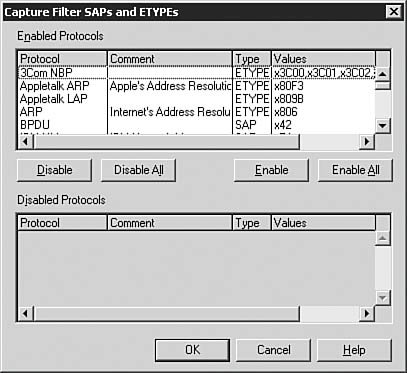
| 3. | If you want to specify any address pairs, do so by selecting the (Address Pairs) item and clicking the Address button to open the Address Expression dialog box, which is shown in Figure 9.8.
Figure 9.8. You can configure specific address pairs from which to examine data. 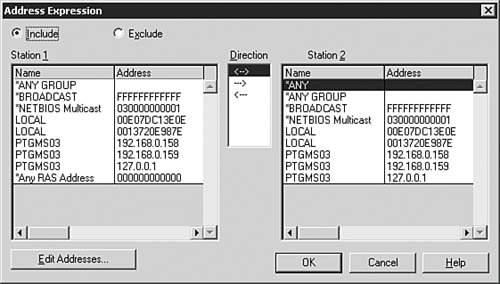
| 4. | If you want to filter on data patterns, select the (Pattern Matches) item and click the Pattern button to open the Pattern Match dialog box, which is shown in Figure 9.9.
Figure 9.9. You can configure filter patterns to filter data by those specific patterns. 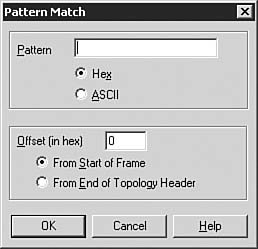
| | | 5. | When you have configured the filters to your liking, click OK to close the Capture Filter dialog box. You can now perform a capture and get only the packets for which you are looking.
|
Sometimes you might have already performed a capture and want to filter out specific data from it. You can do this by clicking the funnel icon or by selecting Display, Filter. In either case, the Display Filter dialog box opens, as shown in Figure 9.10. Figure 9.10. You can configure a filter for data that has already been captured. 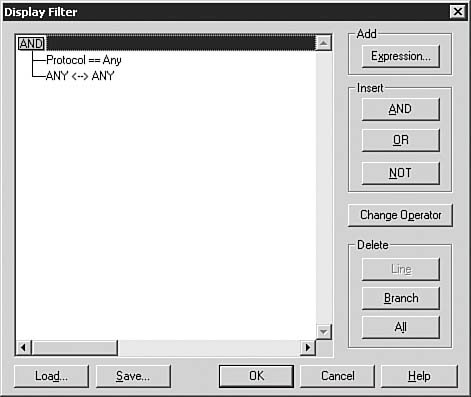
By double-clicking the Protocol == Any item, you open the Expression dialog box, as shown in Figure 9.11. You can use this dialog box to configure a filter, and the most common filter is for a specific protocol type, such as ICMP. Figure 9.11. The Expression dialog box allows you to select how a filter should be constructed. 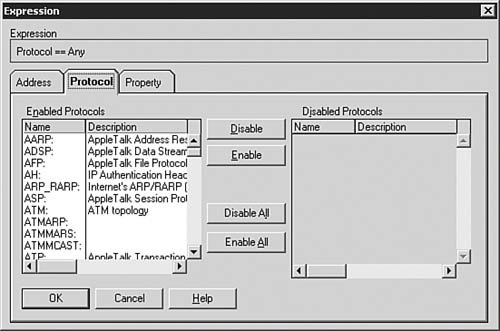
When you've determined the source of any problems with a network, you can begin to implement changes as required. Before you implement changes to a network, you should create a baseline. A baseline is a snapshot of how the network is operating under normal conditions. After you create the baseline, you can make the desired changes and run the test again. After you run the test, you should ask yourself the following questions (among others): Did the changes help or hinder performance? If the changes hindered performance, have I configured all the options for this change properly? Has one area of network performance improved, such as logon times, but other areas of network performance worsened, such as communication between DCs? Is the network capacity more than 75 percent? If so, should I add a switch or router to break up the network?
After you've added and configured the changes to a network, you should create another baseline as a snapshot of the system. Over the next few days, weeks, and months, you should periodically run the same test again and compare the results you get with the baseline. This can help you predict how the network is growing and how the resources are using bandwidth. Using the System Monitor Sometimes you might encounter network problems that the Network Monitor doesn't help troubleshoot. Recall that the version of Network Monitor included in Windows Server 2003 can be used only to capture network traffic going to or from the server on which it is being run. Although there are many capable third-party network sniffers available for you to use, Exam 70-291 is only concerned with the included Network Monitor. Therefore, for the exam, you need to know how to use the System Monitor to monitor the statistics associated with network interfaces. The System Monitor is discussed in Chapter 2, "Implementing, Managing, and Troubleshooting DHCP," as it applies to monitoring DHCP server-related information. This chapter examines how to use the System Monitor to monitor and create baselines for network interface statistics. The following counters are listed under the Network Interface performance object: Bytes Received/Sec This counter measures the rate at which bytes, including framing characters, are received over each network adapter. This counter is a subset of the Bytes Total/Sec counter. Bytes Sent/Sec This counter measures the rate at which bytes, including framing characters, are sent over each network adapter. This counter is a subset of the Bytes Total/Sec counter. Bytes Total/Sec This counter measures the rate at which bytes, including framing characters, are sent and received over each network adapter. Current Bandwidth This counter measures an estimate of the current bandwidth of the network interface, in bits per second. Output Queue Length This counter measures the length of the output packet queue (in packets). If this counter is greater than two, there are delays, and you should find and eliminate the bottleneck, if possible. Packets Outbound Discarded This counter measures the number of outbound packets that were chosen to be discarded even though no errors had been detected to prevent transmission. One possible reason for discarding packets could be to free up buffer space. Packets Outbound Errors This counter measures the number of outbound packets that could not be transmitted because of errors. Packets Received Discarded This counter measures the number of inbound packets that were chosen to be discarded, even though no errors had been detected to prevent their delivery to a higher-layer protocol. One possible reason for discarding packets could be to free up buffer space. Packets Received Errors This counter measures the number of inbound packets that contained errors that prevented them from being deliverable to a higher-layer protocol. Packets Received Non-Unicast/Sec This counter measures the rate at which non-unicast packets are delivered to a higher-layer protocol. Packets Received Unicast/Sec This counter measures the rate at which unicast packets are delivered to a higher-layer protocol. Packets Received Unknown This counter measures the number of packets received through the interface that were discarded because of an unknown or unsupported protocol. Packets Received/Sec This counter measures the rate at which packets are received on the network interface. Packets Sent Unicast/Sec This counter measures the rate at which packets are requested to be transmitted to subnet-unicast addresses by higher-layer protocols. Packets Sent/Sec This counter measures the rate at which packets are sent on the network interface. Packets/Sec This counter measures the rate at which packets are sent and received on the network interface.
Exam Alert: Don't Get Tricked! When taking this exam, carefully read each questionespecially those that deal with performance monitoringto ensure that you select the correct answer. Because many of the monitoring options sound and look similar to each other, you might find several similar answers being presented, but only one of them will be correct.
You can access the System Monitor from the Administrative Tools folder by selecting Start, Programs, Administrative Tools, Performance. When it is initially opened, the Performance console appears as shown in Figure 9.12. Figure 9.12. The Performance console in its default state monitors three basic items. 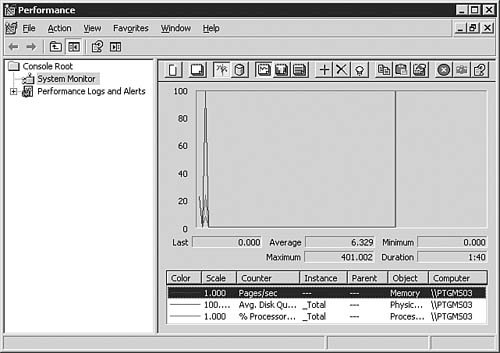
Monitoring Performance by Using the System Monitor Configuring the Performance console to monitor and collect data about the network interface(s) in a server is a simple process, as described in Step by Step 9.5. Step By Step 9.5. Monitoring Network Adapter Statistics 1. | Select Start, Program, Administrative Tools, Performance to open the Performance console.
| 2. | Click System Monitor, as shown in Figure 9.12.
| | | 3. | To add counter items to the System Monitor, click the + icon. The Add Counters dialog box, shown in Figure 9.13, opens, allowing you to begin adding counters.
Figure 9.13. You can add counters to begin monitoring the network adapter statistics. 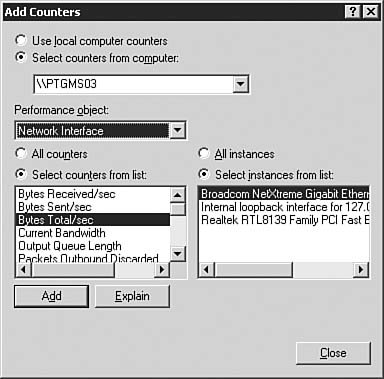
| 4. | Select Network Interface from the Performance Object drop-down list box. The counters that relate to network interfaces and that are available for selection appear. If you need to know what a counter does, select the counter and click the Explain button.
| 5. | Be sure that you are adding counters for the correct network interface in your server and not for the loopback interface. You can do this by selecting the Select Instances from List option and then selecting the correct network interface (as shown in Figure 9.13).
| 6. | When you have decided what counter you want to monitor, click Add. You can add multiple counters either by selecting each counter and clicking Add or by holding down the Ctrl key while you select all the counters you want to monitor and then clicking Add.
| 7. | Click Close when you are finished. Your counters are graphed like those shown in Figure 9.14.
Figure 9.14. You can monitor the selected network interface statistics in real time. 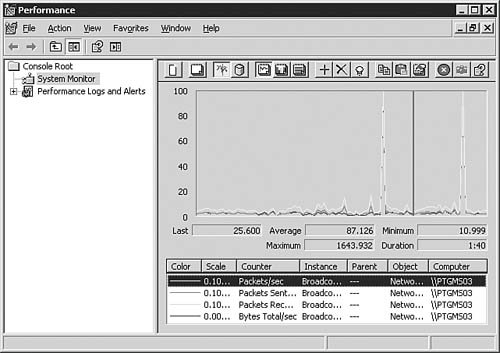
|
Creating Baseline Counter Logs Of course, monitoring the present operation and statistics of network interfaces will present you with only half of the picture. You need to create a baseline of the server performance that can be used to compare against the current performance statistics. You need this baseline to locate problematic areas. This can be very useful when you're performing troubleshooting, and it also aids during periods when configurations are being modified. When creating baseline logs for later comparison, be sure to include all of the counters you might be interested in. When you go to examine the baseline log sometime in the future, you'll only be able to see the counters you configured and obtained data for when you created and configured the baseline in the first place. Typically you will want to include not only network-related counters, but also counters for disk utilization, memory usage, and CPU utilization. To create a baseline, you would create a counter log from the Counter Logs option of the Performance Logs and Alerts node. The creation of a Counter Log is outlined in Step by Step 9.6. Step By Step 9.6. Creating and Using a Baseline Counter Log 1. | Select Start, Program, Administrative Tools, Performance to open the Performance console.
| 2. | Expand the Performance Logs and Alerts node and click the Counter Logs entry, as shown in Figure 9.15.
Figure 9.15. A counter log is created to keep baseline (historical) statistics about performance. 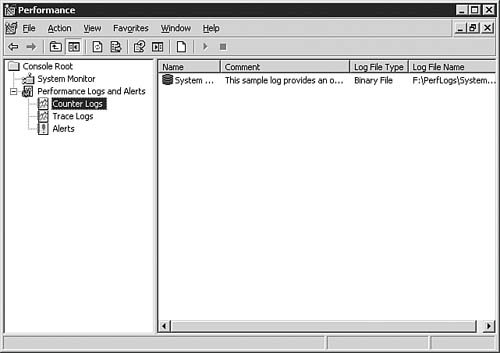
| 3. | To add a new counter log, right-click the Counter Logs entry and select New Log Settings from the context menu.
| | | 4. | Enter the name of the new counter log, as shown in Figure 9.16, and click OK. The Network adapter performance dialog box appears (see Figure 9.17).
Figure 9.16. You should enter a descriptive name for the new counter log. 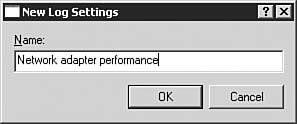
Figure 9.17. You must configure objects or counters on the new counter log before proceeding. 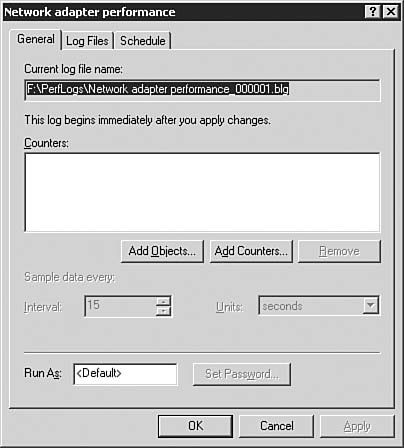
| | | 5. | Configure new entire objects to be monitored by clicking the Add Objects button to open the Add Objects dialog box (see Figure 9.18). Alternatively, you can add individual counters by clicking the Add Counters button to open the Add Counters dialog box (see Figure 9.19). Then, add the objects or counters you desire to the counter log.
Figure 9.18. You can add entire objects to the counter log if desired. 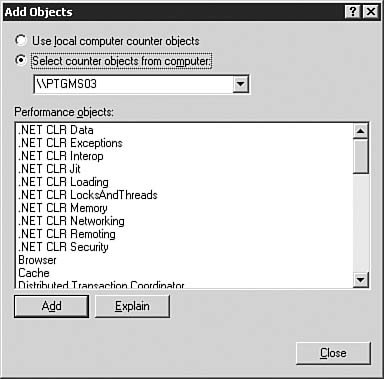
Figure 9.19. You can add specific individual counters to the counter log if desired. 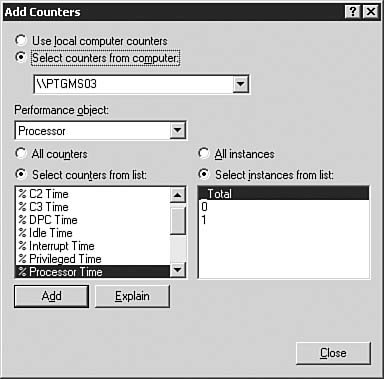
| 6. | After you have added some objects or counters, you can configure the options for the sampling interval. The default is every 15 secondsmeaning that while the counter log is running, data will be collected every 15 seconds from the computers being monitored. The sampling interval has a tradeoff associated with it: Smaller intervals mean larger, more accurate log files; larger intervals result in smaller, less accurate log files. In addition, the smaller the sampling interval, the more resources the performance monitoring consumes. You can also configure the account to be used to run the counter log.
| | | 7. | On the Log Files tab of the Network adapter performance dialog box, shown in Figure 9.20, select the type of log file to be created as well as the numbering system to be used. The default settings are Binary file and nnnnn. The available options are explained after this Step by Step in Tables 9.2 and 9.3. In addition, you can enter a comment that will help identify the counter log.
Figure 9.20. You can use the Log Files tab to configure how the log is to be saved. 
Table 9.2. Counter Log File Format OptionsOption | Description |
|---|
Text File (Comma Delimited) | This option defines a comma-delimited log file (with a .csv extension). | Text File (Tab Delimited) | This option defines a tab-delimited log file (with a .tsv extension). | Binary File | This option defines a sequential, binary-format log file (with a .blg extension). You should use this file format if you want to be able to record data instances that are intermittentthat is, stopping and resuming after the log has begun running. Only binary file formats can accommodate instances that are not persistent throughout the duration of the log. | Binary Circular File | This option defines a circular, binary-format log file (with a .blg extension). You should use this file format to continuously record data to the same log file. This option overwrites previous records with new data when the file reaches its maximum size. |
Table 9.3. Counter Log Numbering SystemsSystem | Example |
|---|
nnnnnn | Network Adapter Performance_000007.blg | mmddhh | Network Adapter Performance_042011.blg | mmddhhmm | Network Adapter Performance_04201126.blg | yyyyddd | Network Adapter Performance_2003111.blg | yyyymm | Network Adapter Performance_200304.blg | yyyymmdd | Network Adapter Performance_20030420.blg | yyyymmddhh | Network Adapter Performance_2003042011.blg |
| | | 8. | Click the Configure button to open the Configure Log Files dialog box, as shown in Figure 9.21. From here you can change the path of the log file and its maximum allowed size. Click OK after you make your changes.
Figure 9.21. You can use the Configure Log Files dialog box to configure the maximum log file size as well as its path. 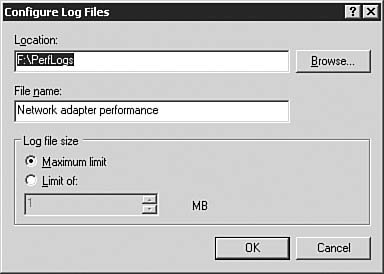
| 9. | On the Schedule tab of the Network adapter performance dialog box, shown in Figure 9.22, you can configure how and when the counter log is to run. Typically you will run it manually, although you might opt to have it run automatically at a configured time.
Figure 9.22. The counter log can be configured to start and stop automatically if desired. 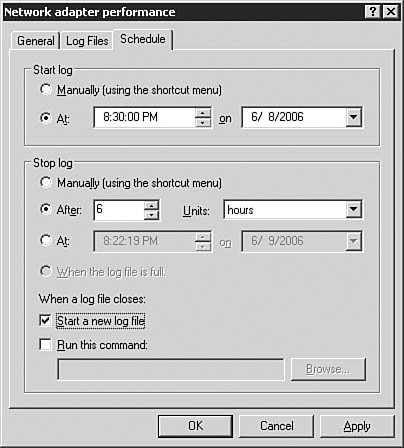
| | | 10. | After you make all your configurations, click OK to save the counter log settings. Back at the Counter Logs node, seen previously in Figure 9.15, select the new counter log object and start it by clicking the start (right arrow) button in the menu. If you configured the counter log to start automatically, as seen in Figure 9.22, it will start at the configured time and run as configured, as seen in Figure 9.23.
Figure 9.23. The counter log automatically starts if you configured it with a start time. 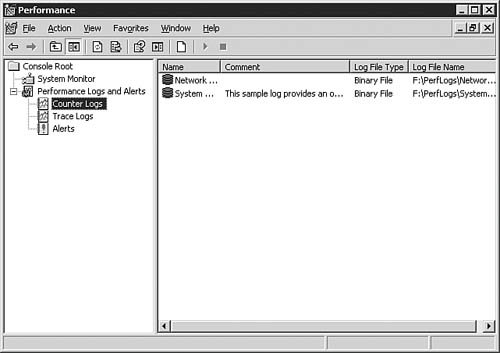
| 11. | After the counter log has run for some time (or for its scheduled time), click the square stop icon to stop it.
| | | 12. | Click the System Monitor node to switch back to the System Monitor. Click the database icon to open a log file, as shown in Figure 9.24. The System Monitor Properties dialog box opens, showing the Source tab (see Figure 9.25).
Figure 9.24. You need to load the counter log file into the System Monitor to examine it. 
Figure 9.25. You can add one or more counter logs to the System Monitor. 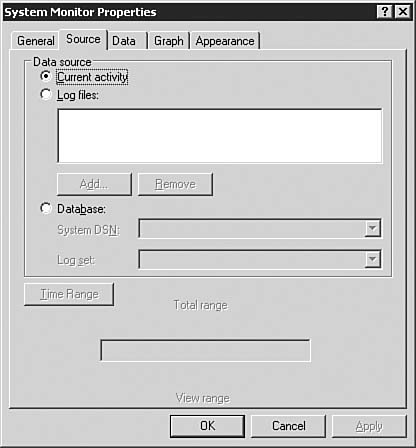
| 13. | Select the Log Files radio button and click the Add button to locate and add the counter log file.
| | | 14. | Switch to the Data tab, as shown in Figure 9.26, and ensure that all counters for which you are interested in seeing data are added. You will see data displayed only for counters that are selected here.
Figure 9.26. You need to ensure that all counters have been added for viewing. 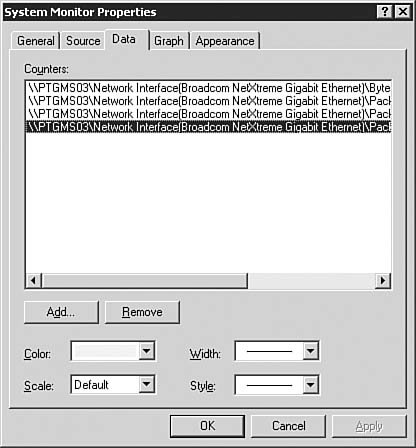
| | | 15. | The counter log data is displayed in the System Monitor, as shown in Figure 9.27. If you need to display only a certain portion of the data, you can do so by configuring the Time Range option on the Source tab of the System Monitor Properties dialog box (refer to Figure 9.25). The counter log options are listed in Table 9.2, and numbering systems are listed in Table 9.3.
Figure 9.27. After you make the correct configurations, you can examine the historical counter log data. 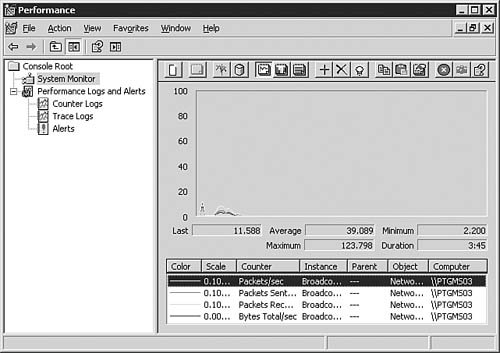
|
System Monitor Tips and Tricks Microsoft provides some helpful tips and tricks that you should keep in mind when working with the Performance console to solve performance-related problems. Through careful analysis of data, you might be able to identify problems with the network that are not otherwise seen. (These include excessive demands on resources that result in bottlenecks.) These problems can slow network performance to the degree that users begin to notice that something is wrong. Exam Alert: Saving Time by Saving Your Configuration No one wants to reinvent the wheel. This holds true even when you are configuring System Monitor with a set of counters. You can save a good amount of time and effort by setting up the System Monitor with the counters and options you desire on one server and then saving the configuration file and distributing that file to each of your other servers. This saves you from re-creating the configuration each time you want to monitor the same items.
The following are some of the most common causes of bottlenecks that you might encounter while troubleshooting your network: The current level of provided resources is inadequate, thus requiring additional or upgraded resources to be added to the network. The available resources are not utilized evenly, thus requiring some form of load balancing to be implemented. An available resource is malfunctioning or stopped and needs to be repaired or restarted. An available resource is incorrectly configured, thus requiring a configuration correction.
After you have identified a problem, you should take care to avoid creating new problems while correcting the old one. You should make one change at a time to avoid masking the impact of changes. After each change, you should perform additional monitoring to determine the result and the effect of the change and reevaluate the status and condition of the previously identified problem(s). In addition, you can compare the performance of applications that are run over the network to their performance when run locally to determine how the network is affecting performance. The following are some basic network configuration tips that you can implement while troubleshooting and correcting network-related problems: As often as possible, ensure that resources are located on the same physical subnet as the users using the resource. Uninstall or unbind network protocols that are not in use. Configure the network protocol binding order to place the most commonly used protocols higher on the list. Use multiple network adapters in high-use servers to increase effective network throughput. If you're going to monitor disk, CPU, and/or memory utilization as well, you'll want to monitor those items from a remote server or workstation. Monitoring of disk, CPU, and memory utilization can actually add load on these items if monitored locally, possibly making the output of the monitoring invalid or inaccurate.
Exam Alert: Don't Forget the Task Manager Even though it's a simple tool, don't underestimate the usefulness of the Task Manager. You can quickly launch the Task Manager to get a real-time look at network utilization (and process performance) without having to open the System Monitor and configure counters.
|