Working with Views and Fields
As you use Project Web Access to review project, task, resource, and assignment information, you work with a number of different views, tables, and fields. For example, in the Project Web Access navigation bar, click Projects, and the Project Center view appears (see Figure 24-3). In this view is a table, probably with a Gantt chart, showing your enterprise projects.
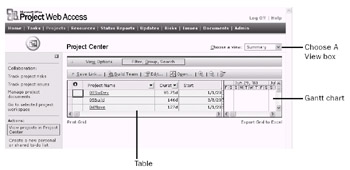
Figure 24-3: Go to the Project Center to review the list of enterprise projects.
A variety of views are available, set up by the project server administrator for users with different permission levels. You can switch to another view by clicking in the Choose A View box in the upper-right corner. Alternate views in the same page show different fields for the same category of information, such as this set of projects or the individual project. You'll see these same elements in many of the views you work with in Project Web Access.
![]() Many views you work with are a type of Gantt chart. In a Gantt chart, the left side of the view is a table, and the right side displays the Gantt bars, showing the start, duration, and finish of each item (project, task, resource, assignment) across the timescale . The current date is shown as a dashed vertical line. Click the Zoom In or Zoom Out buttons to see more or less detail in the time span shown in the chart area.
Many views you work with are a type of Gantt chart. In a Gantt chart, the left side of the view is a table, and the right side displays the Gantt bars, showing the start, duration, and finish of each item (project, task, resource, assignment) across the timescale . The current date is shown as a dashed vertical line. Click the Zoom In or Zoom Out buttons to see more or less detail in the time span shown in the chart area.
Understanding Fields
![]() You can have either read-write or read-only access for the table fields in the view. Work with your project server administrator to make sure you have the access to the fields you need in the views you use most often.
You can have either read-write or read-only access for the table fields in the view. Work with your project server administrator to make sure you have the access to the fields you need in the views you use most often.
New Feature Certain types of custom fields might have been created and added to your Tasks list by the project manager or project server administrator. Some of these custom fields can contain a value list from which users can choose an appropriate option. If such a custom field is part of a view that you are modifying, and if you have read-write permission, click in the field. A drop-down list shows all the choices. Click a choice, and that value now appears in the field. This makes it easy for you to enter the correct form of information while maintaining project data integrity.
Rearranging View Information
In project and resource views, you can sort , group , or filter information by criteria you choose.
To sort items in a view by a particular field, follow these steps:
-
In the view, click the heading of the field column you want to sort by.
The field is sorted in either ascending or descending order.
-
To sort in the other direction, click the column heading a second time.
To group items by a particular field in a view, follow these steps:
-
Display the view you want to work with.
-
Above the table, click Filter, Group, Search.
-
In the expanded section that appears, click the arrow in the Group By box to see your grouping choices in the drop-down list (see Figure 24-4).
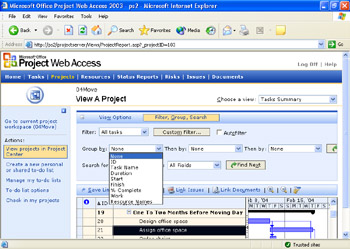
Figure 24-4: Click the field by which you want to group the information. -
Click the field you want to group by.
The table changes to reflect your grouping.
-
If you want a subgroup within the group, click Second Field in the Then By box.
Some views also provide a third Then By box.
-
When you want to return to the original non-grouped order, click None in the Group By box.
To filter items by a built-in filter in a view, follow these steps:
-
Display the view in which you want to filter information.
-
Above the table, click Filter, Group, Search.
-
In the expanded section that appears, click the arrow in the Filter box to see your filter choices.
-
Click the filter you want to use.
The table changes immediately to show only those items that meet your filter criteria.
-
To see all items in the table again, click All Tasks (or All Resources or All Projects) in the Filter box.
To create a custom filter, follow these steps:
-
Display the view in which you want to filter information.
-
Above the table, click Filter, Group, Search.
-
In the expanded section that appears, click Custom Filter.
-
In the More Filters dialog box, enter the field you want to filter by in the Field Name box (see Figure 24-5).
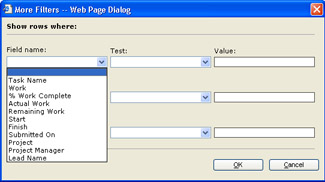
Figure 24-5: Click the field by which you want to filter your view information. -
In the Test field, enter the test criteria, for example, Equals or Contains.
-
In the Value field, enter the value for the field and then click OK.
The task list changes immediately to show only those items that meet your filter criteria.
-
To see all items in the table again, click All Tasks in the Filter box.
You can also select the AutoFilter check box to add the AutoFilter arrows to each column in the current view.
To collapse the Filter, Group, Search section, click the “ (minus) button in the upper-left corner of the section.
Printing or Exporting a Table
New Feature In Project Web Access 2003, you can now print the table on the following pages:
-
Tasks
-
Projects
-
Resources
-
Updates
-
Risks
-
Issues
-
Documents
You can also use this function to export the contents of the table to a Microsoft Office Excel 2003 workbook. To print or export a Project Web Access table, follow these steps:
-
Display the view containing the table you want to print.
-
Below the table, click Print Grid on the left or Export Grid To Excel on the right.
The grid setup page appears (see Figure 24-6).
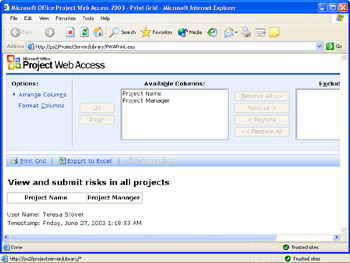
Figure 24-6: Set up the columns you want printed or exported. -
Select field names in the Available Columns box and use the Up and Down buttons to rearrange the order of the columns as it will be printed or exported.
-
If you want to exclude any fields from the print or export operation, click its name in the Available Columns box and then click the Remove button.
This removes the column only for the print or export operation. The field is still present in the view itself.
A preview of the printed report or exported workbook appears in the lower half of the view.
-
Click Print Grid to send the report to the printer. Click Export To Excel to send the report to an Excel workbook.
EAN: 2147483647
Pages: 268
- Chapter V Consumer Complaint Behavior in the Online Environment
- Chapter X Converting Browsers to Buyers: Key Considerations in Designing Business-to-Consumer Web Sites
- Chapter XI User Satisfaction with Web Portals: An Empirical Study
- Chapter XII Web Design and E-Commerce
- Chapter XVIII Web Systems Design, Litigation, and Online Consumer Behavior