Centering Printouts
The previous section explained how to handle a common scenario: printing large amounts of text. Another common scenario is printing a picture centered on the printed page. To do that, you must move the drawing vertically and horizontally to put it at the correct position. You can do this by using the Graphics object’s TranslateTransform method. That method defines a translation transformation for all the graphics drawn by the object. After you set the transformation, you can draw any graphics as usual, and the Graphics object automatically moves them to the correct position.
The CenterPictureInMargins subroutine shown in the following code defines a translation transformation that centers an area within some specified bounds. The routine begins by calling the Graphics object’s ResetTransform method to remove any transformations that may already be defined. Next, the routine calculates the horizontal and vertical offsets by which it must translate the rectangle picture_ bounds so that it will be centered within the rectangle margin_bounds. It calls the Graphics object’s TranslateTransform method to make the translation.
' Transform the Graphics object to center the rectangle ' picture_bounds within margin_bounds. Private Sub CenterPictureInMargins(ByVal gr As Graphics, _ ByVal picture_bounds As RectangleF, ByVal margin_bounds As RectangleF) ' Remove any existing transformation. gr.ResetTransform() ' Apply the transformation. Dim dx As Single = _ margin_bounds.Left - picture_bounds.Left + _ (margin_bounds.Width - picture_bounds.Width) / 2 Dim dy As Single = _ margin_bounds.Top - picture_bounds.Top + _ (margin_bounds.Height - picture_bounds.Height) / 2 gr.TranslateTransform(dx, dy) End Sub You can use subroutine CenterPictureInMargins to prepare the e.Graphics object provided by the PrintPage event handler to center a drawing on a printout. For example, the following PrintPage event handler code draws a bar chart in the coordinate space 100 <= X <= 600, 100 <= Y <= 400. It begins with commented code that draws the page’s margins for debugging purposes.
The code defines rectangles representing the area in which it will draw and the printed page’s margin bounds. It passes those rectangles to the CenterPictureInMargins subroutine to prepare the Graphics object for centering.
Next, the program fills the picture area’s rectangle with light gray and outlines it in black. It then calls subroutine DrawBar several times to draw five values for the bar chart. The event handler sets e.HasMorePages to False and ends.
Subroutine DrawBar draws a rectangle for the bar chart. It draws its rectangle at the X coordinate passed as a parameter, making it 100 units wide and hgt units tall. It fills the rectangle with a hatch pattern and then outlines it in black. The subroutine finishes by adding 100 to x, so the next call to DrawBar draws a rectangle to the right.
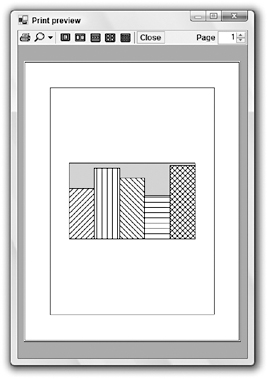
' Print the page. Private Sub Print_PrintPage(ByVal sender As Object, _ ByVal e As System.Drawing.Printing.PrintPageEventArgs) ' Draw the margins (for debugging). Be sure ' to do this before transforming the Graphics object. e.Graphics.DrawRectangle(Pens.Red, e.MarginBounds) ' This routine draws a bar chart for 5 values ' in printer coordinates between ' (100, 100) - (600, 400). ' Transform the Graphics object to center the results. Dim picture_rect As New RectangleF(100, 100, 600, 400) Dim margin_rect As New RectangleF( _ e.MarginBounds.X, _ e.MarginBounds.Y, _ e.MarginBounds.Width, _ e.MarginBounds.Height) CenterPictureInMargins(e.Graphics, picture_rect, margin_rect) ' Draw a rectangle around the chart. e.Graphics.FillRectangle(Brushes.LightGray, picture_rect) e.Graphics.DrawRectangle(Pens.Black, Rectangle.Round(picture_rect)) ' Draw the values. Dim x As Integer = 100 DrawBar(e.Graphics, x, 200, HatchStyle.BackwardDiagonal) DrawBar(e.Graphics, x, 280, HatchStyle.Vertical) DrawBar(e.Graphics, x, 240, HatchStyle.ForwardDiagonal) DrawBar(e.Graphics, x, 170, HatchStyle.Horizontal) DrawBar(e.Graphics, x, 290, HatchStyle.DiagonalCross) ' There are no more pages. e.HasMorePages = False End Sub ' Draw a bar in (x, 400)-(x + 100, 400 - hgt). Private Sub DrawBar(ByVal gr As Graphics, ByRef x As Integer, _ ByVal hgt As Integer, ByVal hatch_style As HatchStyle) Dim rect As New Rectangle(x, 400 - hgt, 100, hgt) Using hatch_brush As New HatchBrush(hatch_style, Color.Black, Color.White) gr.FillRectangle(hatch_brush, rect) End Using gr.DrawRectangle(Pens.Black, rect) x += 100 End Sub Figure 24-5 shows the result. You can see in the picture that the bar chart is centered within the margins.

Figure 24-5: Subroutine CenterPictureInMargins makes it easy to center a picture within a printed page.
EAN: N/A
Pages: 417