THE POPULATION REGRESSION LINE
When you calculate a regression line that is used only to describe an observed relationship between two variables, you have two concerns. Are the variables measured on an interval or ratio scale, and does their relationship appear to be linear? It makes no sense to calculate a regression line relating religious preference to the region in which someone lives. The categories of these variables have no order, and a statistic such as the slope is meaningless. Even if the two variables are measured on an interval scale, it makes no sense to calculate a regression line if their relationship is not linear. You may need to fit some other mathematical function besides a straight line, or perhaps change the scale on which the variables are measured. Those topics are mostly beyond the scope of this book, but we will talk a little about them in our discussion about residuals.
When you are interested in drawing conclusions about the population regression line, you need additional assumptions. First, we need to clarify what we mean by a "population regression line." In all of our previous discussions about hypothesis testing, we considered our data to be a random sample from some underlying population. We wanted to draw conclusions about the population based on what we saw in our sample. When we computed a sample mean, we considered it to be our best guess of the population mean. When we computed a correlation coefficient, we considered it our best guess for the value of the correlation coefficient in the population.
What we will be doing now is very similar. We will try to draw conclusions about the relationship of two variables in the population based on the results we see in our sample. If we had been able to include our entire population in the study, we could calculate a regression line that describes the relationship between the two variables in the population. This would be the "true" or population regression line . We do not know what the true line is, since all we have is a sample from the population. We do not know the true slope or the true intercept. We do have some evidence about what they are, however. Our best guess for the population line is the results observed in our sample.
To be able to test hypotheses about the population line statistically, we must make some assumptions about the population. We need these assumptions so we will know that the sampling distributions of the slope and intercept will be normal. (The sampling distribution of the slope is the distribution of the values of the slope that you would get if you took all possible samples of a particular size from a population. The sampling distribution of the intercept is defined similarly.) As before, our computations of the observed significance level will be based on these sampling distributions.
To be able to test a hypothesis about the population line statistically, we must make some additional assumptions about the population. They are:
-
The distribution is normal.
-
All of these distributions have the same variance.
-
Linearity exists.
-
All observations are selected independently.
We have just stated that to test hypotheses about the population line, we need to assume that the distributions of the dependent variable must be normal for each value of the independent variable and that the variances of those distributions must be equal. Now, what about the means of the distributions? If a linear relationship exists in the population between the two variables, then the means of all of the population distributions must fall on a straight line. To test regression hypotheses, we must assume that this is true. Look at Figure 9.1, which schematically shows the assumptions we have been talking about. In the population, a true regression line exists that specifies the relationship between the variables. This line is drawn in on the plot. For each value of the independent variable there is a distribution of the values of the dependent variable. These distributions are all normal and have the same variance. The means of all of these distributions fall on a straight line.
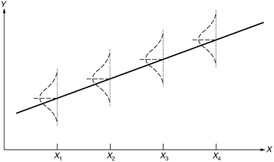
Figure 9.1: Regression assumptions.
The last assumption that we need for linear regression analysis is that all observations are selected independently. That is, including one observation/person in the sample should not in any way alter the chance of any other observation/person being included.
EAN: 2147483647
Pages: 252
- Chapter III Two Models of Online Patronage: Why Do Consumers Shop on the Internet?
- Chapter IX Extrinsic Plus Intrinsic Human Factors Influencing the Web Usage
- Chapter X Converting Browsers to Buyers: Key Considerations in Designing Business-to-Consumer Web Sites
- Chapter XII Web Design and E-Commerce
- Chapter XVI Turning Web Surfers into Loyal Customers: Cognitive Lock-In Through Interface Design and Web Site Usability