ANALYSIS OF VARIANCE IN COMPUTER SOFTWARE
Each software package has its own quirks , but all of the software dealing with ANOVA has some things in common. You use the ANOVA command to perform analysis of variance with more than one factor. ANOVA does not include the multiple comparison procedures that ONEWAY offers, but it does allow you to analyze the effects and interactions of several factors at once. To analyze the effect of the main variables , you have to specify the dependent variable first and then enter the range of categories that should be used in the analysis.
All software packages show the results of an analysis in what is called the ANOVA table. This analysis of variance table may be very elaborate or very simple depending on the demands that the experimenter has set for the analysis. A typical table will have columns for sums of squares, degrees of freedom, mean squares, the F ratio, and the significance of F. Under MAIN EFFECTS are the statistics for the variables under study, considered separately. (The statistics across from MAIN EFFECTS let you evaluate the significance of all the single-variable effects considered together, if you want to do that.) Under 2-WAY INTERACTIONS are the statistics for the interactions between the selected variables. The row labeled RESIDUAL contains the within- cell sum of squares and mean square. What we want to do in the residual analysis is to identify those specific variables that violate the assumption of linearity (if indeed such variables exist) and apply the needed remedies only to them. Also, the identification of outliers or influential observations is facilitated on the basis of one independent variable at a time. Typical patterns of residual analysis are shown in Figure 7.1.
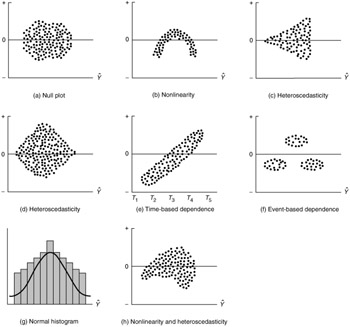
Figure 7.1: Typical graphical analysis of residuals.
For each effect in the table, the F statistic is calculated as the ratio of the mean square for that effect to the mean square for the residual.
To obtain multiple comparison tests, we enter a slash, the RANGE subcommand, and the name of the test after the previous specification. Some of the tests are:
-
Least significant difference
-
Duncan's multiple range test (one of the most common used)
-
Student-Newman-Keul's test
-
Tukey
-
Tukey's honestly significant difference
-
Modified least significant difference
-
Scheffe's test
For a detailed explanation for each one of these, see Winer (1971).
How can you test the null hypothesis that several population means are equal? Here is what you need to know:
-
Analysis of variance can be used to test the null hypothesis that several population means are equal.
-
To use analysis of variance, your groups must be random samples from normal populations with the same variance.
-
In analysis of variance, the observed variability in the samples is subdivided into two parts ” variability of the observations within a group about the group mean ( within-groups variation) and variability of the group means ( between-groups variation).
-
The F statistic is calculated as the ratio of the between-groups estimate of variance to the within-groups estimate of variance.
-
The analysis of variance F test does not pinpoint which means are significantly different from each other,
-
Multiple comparison procedures, which protect you against calling too many differences significant, are used to identify pairs of means that appear to be different from each other.
EAN: 2147483647
Pages: 252