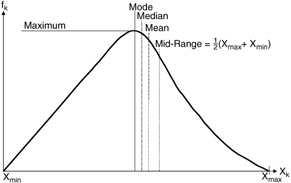
OTHER MEASURES OF CENTRAL TENDENCIES
-
Mean: Average value f k calculated from all observations (center of gravity).
Example - Found mean X to be 3.15 people
-
Mode: Most frequently observed value of X k , highest f k .
Example - Maximum f k = 8 cars occurs when X k = 2 people
-
Median: Value of ordered X k that divides data in half.
Example - Half (n/2 = 10) data points lie below, half above 3
-
Mid-Range: Value halfway between minimum and maximum observed values.
1/2 (Maximum + Minimum) = 1/2 (6 + 2) = 4 people
Six Sigma and Beyond: Statistics and Probability, Volume III
ISBN: 1574443127
EAN: 2147483647
EAN: 2147483647
Year: 2003
Pages: 252
Pages: 252
Authors: D. H. Stamatis