MEASURES OF ASSOCIATION
As in the case of univariate analysis, it is desirable to have a measure of association between the independent and the dependent variables in multivariate analysis. Of several such measures that have been proposed (Huberty, 1972, 1975; Shaffer and Gillo, 1974; Smith, 1972; Stevens, 1972; Tatsuoka, 1970, 1971), only one will be presented here. The measure to be presented is related to Wilks' (lambda), which is defined as

where W = pooled within-groups SSCP and T = total SSCP. Note that lambda is a ratio of the determinants of these two matrices.
Before describing the measure of association that is related to lambda, it will be instructive to show how lambda can be expressed for the case of univariate analysis. Recall that in the univariate analysis of variance the total sum of squares (SS t ) is partitioned into between-groups sum of squares (SS b ) and within-groups sum of squares (SS w ). Accordingly, in univariate analysis,

Since SS t = SS b + SS w , can also be written
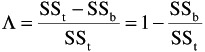
and, from the preceding ,

As is well known, the ratio of SS b to SS t is defined as · 2 ” the proportion of variance of the dependent variable accounted for by the independent variable or group membership. It is clear, then, that lambda indicates the proportion of variance of the dependent variable not accounted for by the independent variable or the proportion of error variance, and that lambda may vary from zero to one. When = 0 it means that SS b = SS t , and that the proportion of error variance is equal to zero. When, on the other hand, = 1, it means that SS b = 0 (SS w = SS t ) and that the proportion of error variance is equal to one.
Finally, when the dependent variable is regressed on coded vectors that represent a categorical independent variable, the following equivalences hold:
SS w = SS res ; SS b = SS reg ; · 2 = R 2
where SS res = residual sum of squares, SS reg = regression sum of squares, and R 2 = squared multiple correlation of the dependent variable with the coded vectors. Accordingly, A may be expressed as follows
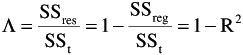
and
R 2 = 1 -
From the above, one may conceive of 1 - in multivariate analysis as a generalization of · 2 or R 2 of univariate analysis. When in multivariate analysis = 1 it means that no association exists between the independent and the dependent variables. When on the other hand, = 0, it means that a perfect association exists between the independent and the dependent variables.
It would be an incomplete discussion if we did not mention the relationship of the test of to the F test. At least in a special case for two groups the following formula is the one that is used:
F = [(1 - )/t]/[ /N - t - 1)]
where t is the number of dependent variables and N is the total number of subjects. The df for this F ratio are t and N - t - 1. This is identical in form to the test we mentioned above (R 2 ), when a coded vector representing group membership was regressed on the dependent variables.
EAN: 2147483647
Pages: 252
- ERP System Acquisition: A Process Model and Results From an Austrian Survey
- Distributed Data Warehouse for Geo-spatial Services
- Healthcare Information: From Administrative to Practice Databases
- A Hybrid Clustering Technique to Improve Patient Data Quality
- Development of Interactive Web Sites to Enhance Police/Community Relations
- Chapter V Consumer Complaint Behavior in the Online Environment
- Chapter VII Objective and Perceived Complexity and Their Impacts on Internet Communication
- Chapter VIII Personalization Systems and Their Deployment as Web Site Interface Design Decisions
- Chapter X Converting Browsers to Buyers: Key Considerations in Designing Business-to-Consumer Web Sites
- Chapter XV Customer Trust in Online Commerce