Chapter 1: The Need for Improvement
This chapter introduces the reader to variation and to the overall picture of statistical process control (SPC). In the discussion of SPC, a model is introduced, and the components of that model are discussed.
OVERVIEW
The Japanese have a word, muda, that perhaps articulates their commitment to their quality efforts over the last 30 or so years . Muda stands for waste. Waste indeed is the enemy of every organization (profit or not for profit, manufacturing, service, or whatever). The Japanese for a long time have been able to attack the majority of their quality issues and concerns in the name of muda.
Muda is variation. We know it as a culture; we know it as individual organizations. We preach that variation is World Enemy Number One. We associate variation with waste all day long in all walks of life, including manufacturing, education, government, service organizations, and so on, for a long list.
Statistical process control (SPC) introduces the principles of continual improvement in any situation, provided that there is a willingness to understand what is really going on in the process and to improve that process if things are not what they should be. There are many models that one may follow for this continual improvement. A typical SPC model is shown in Figure 1.1.
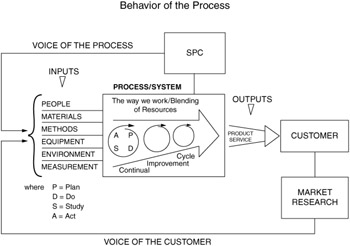
Figure 1.1: A typical SPC model.
This particular model is based on the work of Shewhart and Deming and is a composite of many ideas. What makes this model interesting is that it forces the reader to visualize what is really happening in the system. But, you may wonder , what system? The answer is simple. There are inputs that go into the process ”for all intents and purposes, the energy transformation, the reason for our existence ”and there are outputs that must satisfy some predefined customer.
Of paramount importance is the box, rather the inside of the box, that is labeled "process/system." The reader will notice that the emphasis is not really in the forward-feedback loop, as in Figure 1.3, but rather in an upward swirling motion of the plan-do-study-act (PDSA) model. The significance of this motion is in the fact that, finally, there is a recognition that no matter how good a process is, it is not good enough in the long term . That process must change, must improve, so that it may meet the needs, wants, and expectations of the customer. Above all, though, it must produce the product or service in a consistent manner and provide value to the customer with no variability, or at least with very minimal variability.
How do we do that? First, we recognize what SPC is and is not (see Table 1.1).
| What SPC Is | What SPC Is Not |
|---|---|
| A tool kit that provides immediate feedback on technical and administrative processes | A short-term cure-all |
| An indicator of total performance for technical and administrative processes | A quality control or assurance program |
| A system that uses measurements obtained and analyzed by those who work with the process | Only a worker motivation program |
| A structured approach to problem solving | A haphazard approach to problem solving |
| A record of the behavior of the process | A way to reprimand workers |
| Sound information for decision making by management | A tool to manipulate the data or process to get the desired results |
| A system that allows the process owner to have control over the process, with the appropriate authority and responsibility to change and modify the process as needed | A tool to instill fear in the worker |
Second, we must recognize that the majority of our problems are system errors, not worker errors. Deming and Juran, as well as Crosby, quantified that ratio in a 1992 ASQ conference in Milwaukee as 94 versus 6%. Whether you agree or disagree with the exactness of that percentage, the point is that there is plenty of room to see that the error attributable to systems is much, much greater that that attributable to the worker. (The reader may find it interesting to know that the original ratio given by Deming in 1982 was 85% versus 15%). The system errors are a direct outcome of management understanding and intervention. It is important for anyone working in an improvement area to understand that Deming identified the 14 management obligations as a basis for that improvement. In fact, he also identified seven deadly sins as the forces that perhaps will inhibit the improvement in a given organization. The reader will find the 14 obligations and Deming's deadly sins in Appendix B.
Third, we must all recognize that the system is us. Us, of course, includes the customer, sales, marketing, manufacturing, distribution, technical representative, testing, administrative services, research and development, and everyone else who comes in contact with the process.
Fourth, we must recognize, as Deming did, that the application of statistical principles and techniques in all stages of development, production, and distribution is directed toward a customer. If that customer is not satisfied, he or she will find another source.
Fifth, we must recognize and use the power of statistical thinking and its appropriate application in our processes.
Sixth, we must shift our paradigm thinking from the traditional emphasis on quality ”which is the specification mentality ”to emphasis on the target. The first, of course, is the goalpost approach and is shown in Figure 1.2. The idea here is that as long as we are within the goal post, we are OK. In reality, of course, that presents a problem for the specifications.
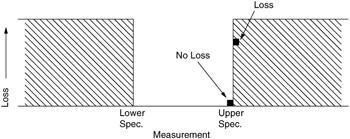
Figure 1.2: The goalpost mentality.
In Figure 1.3, on the other hand, one can see that as long as we are at target, we really do not care about specifications. This is known as Taguchi's Loss Function. As we deviate from the target, the variation begins and costs us an increase in dollar loss.
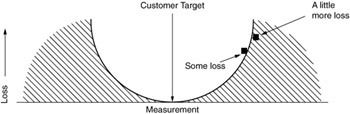
Figure 1.3: The loss function.
So, if one were to ask whether we need improvement, the answer would be an obvious yes! But why? The answer, of course, lies in variation, which we defined earlier as muda. By reducing variability, SPC enables both product and process productivity to be predicted with increasing precision. But toward what end? The answer again is, "to the level that the customer perceives as value."
Unfortunately, value is not a static notion. In fact, it is very dynamic and quite often unpredictable. But then again, that is where SPC can help. By recognizing that the concept of quality improvement and the concept of supplier-customer interaction are inseparable (see Figure 1.1), we fall into the inside of the box, the process, which forces us to look at the continual improvement cycle.
This is a very important concept because it communicates to us the notion that quality and/or continual improvement is a never-ending process. Once the commitment from an organization is articulated and put in place, the beginning stages of this endeavor become the first steps of a long journey, a way of life, a cultural philosophy. Certainly, under any conditions, if this journey becomes a project, then the writing is on the wall for failure.
Successful SPC involves a long-term commitment at all levels in a given organization, beginning at the top. There is a beginning, but there is no end. Quite often, we have heard that the SPC and total-quality management systems are dead because they did not produce the results that they promised . Perhaps not. But we suggest that the failure was not ”if, in fact, we call it a failure ”because of the tools and the methodology. It was because of many other factors, including but not limited to the following:
-
Lack of top-management support
-
Lack of middle-management support
-
Commitment in only some, not all, departments
-
Failing to stay on course (only short-term expectations)
-
No market research ”no idea what the customer considers important
-
No testing ”no idea what is coming into the process
-
Overselling expectations ” especially to the workers and process owners
-
Adversarial management ”management by intimidation and fear
-
Failing to listen to the process owners and workers
-
Overdependence on computers
-
Funding failure ”limited resources to make appropriate and applicable changes in the system
-
Forcing success based on short-term results ”driven by quarterly profits
-
Failing to provide appropriate training to the work force
-
Failing to acquire the services of a competent statistician for advanced analysis
-
Haphazard approach ”tampering with the process
That last item is perhaps the most famous of all, in the sense that both scientists (Deming) and an anonymous poet have articulated the issue. Deming identified tampering as one of the plagues of many organizations today, and he explained it with his funnel experiment (see Chapter 6). The anonymous poet has immortalized it with the following:
Off we go to the milky way
tamper tamper is the game,
try to make it all the same.
Squeak and tweak it every day.
Off we go to the milky way.
When we see variation, the question that we must ask is, is the variation in our process abnormal? If the answer is yes, then we should look in the process for causes, and appropriate action must be taken by operator, clerk, or management. If, on the other hand, we see only normal variation, then our process is stable, and looking around for quick answers or to make adjustments is tampering. Reducing the variation in a stable system requires a system change, which is usually the responsibility of management. By the way, control charts identify the stable process, that is, what normal variation is.
One may ask at this point, what is the point of continual improvement? After all, once a product or service meets market specifications, why go further? At this point, the customer appears to be satisfied. A fair question. Let us try to give an answer.
-
One reason is that the more consistent the quality of a product or service, the more regular the behavior of the process that produces it. It is a matter of common sense and experience that the more regular the performance of a process, the lower its overall operating costs.
-
Another reason concerns the specifications that a product is designed to meet. Traditionally, these are expressed in discrete units ”24-day strength shall not be less than, say, 4600 psi; setting time will be at least 2 hours but not more than 6 hours; and so on. Such specifications, though commonplace, are not very realistic and quite often produce dissatisfied customers.
Let us clarify these two points with an example. Suppose for example that the minimum strength specification is 4600 psi at 28 days. What is the error in the test? Conversely, if the number had been 4650 psi, would this mean that it is totally acceptable? A more realistic approach to quality is to assign maximum desirability to a product that is centered on the customer's target and progressively less as its performance is farther and farther away from that target.
If we buy into this approach, the importance of meeting specifications becomes secondary to the importance of staying on target. However, the reader is reminded that a process that stays closest to target will have a competitive edge, even though other processes or even suppliers remain in specification.
EAN: 2147483647
Pages: 181