COMMON VARIATION
A process that operates with only common variation is predictable, repeatable, consistent, and stable. A process with this type of variation is labeled "in control." The control chart in Figure 11.1 shows an in-control process.
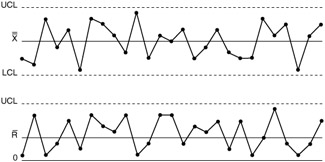
Figure 11.1: A process in control.
All of the sample points are plotted within the control limits, and the points follow random patterns around the process center line or average. When 25 or more data points are in control, the percentage of products inside and beyond the product specifications may be estimated with a relatively high level of confidence.
A process that is in control may not be desirable. It is simply predictable and repeatable. If the average defective rate is high, this is an undesirable situation (see Figure 11.2).
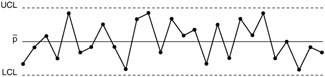
Figure 11.2: An undesirable situation with defectives.
A high defective rate is to be expected and will continue as long as the process remains in control. Process improvements (reducing the percentage outside the product specifications) require a change in the process operation. This change will be signaled as an out-of-control situation.
EAN: 2147483647
Pages: 181