P CHARTS
P CHARTS
Control charts for nonconforming (defective) parts offer several advantages:
-
They are easily understood ,
-
They can be made with the data collected for inspection or management reports ,
-
They provide general overviews of product quality and process efficiency, and are simple and quick to construct.
Control charts for defective parts have several significant disadvantages:
-
They detect problems rather than prevent them,
-
They do not provide detailed information for specific product characteristics.
-
They do not indicate the defective's degree of unacceptability.
STEPS FOR CONSTRUCTING A P CHART
1. Establish a Sampling Plan for the Control Chart
-
Determine an appropriate sample size (n). The sample size used to construct a p chart must be large enough so that a typical sample subgroup contains nonconforming (defective) parts. The sample size ( n ) directly influences the sensitivity of the control chart and must be selected with care. Larger sample sizes make very sensitive control charts (the control limits are close to the process center line). Smaller sample sizes make the control limits farther from the center line and therefore less sensitive. Although the sample sizes do not have to be equal for this control chart, they should not differ by more than 25% of the average sample size (nbar).
-
Determine a sampling frequency. Collect sample subgroups often enough to provide diagnostic information. People must identify special causes of variation and search for the cause of the unexpected variation. Problem-solving activities are easier to perform when the subgroups are collected at reasonable intervals. The rate of process change defines an appropriate sampling interval. If the process changes often, very frequent sampling is necessary. Stable processes can tolerate less frequent sampling. When insufficient information is available for planning sampling frequency, sample as often as possible. After a stable and in-control process is established, the time interval between sample subgroups may be increased slowly.
-
Record the process data on the control chart. Record the number of defective parts ( np ), sample size ( n ), time, shift, and date for each subgroup on an attribute control chart form. Maintain a process log as a record of all major changes to the process (e.g., changes in machinery, material, methods , or personnel). This log helps people identify the causes for out-of-control conditions.
2. Calculate the Proportion ( p ) of Nonconforming Parts
Use the following formula to calculate the proportion of nonconforming parts in each subgroup:
p = np · n
where
| p | = | proportion defective |
| np | = | number of defective parts |
| n | = | sample size |
3. Calculate the Process Center Line
Calculate the mean for the sample proportion defective (pbar) with the following:
pbar = & pound ; np · n = ( np 1 + np 2 + · · ·+ np k ) · ( n 1 + n 2 + · · ·+ n k )
where
| pbar | = | mean proportion defective |
| np | = | sum of the defective parts |
| n | = | sum of the sample sizes |
4. Calculate the Standard Deviation ( ƒ p ) for the Proportion Defective
Use the following to calculate the standard deviation for proportions :
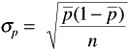
where
| ƒ p | = | standard deviation for proportions. |
| pbar | = | mean proportion defective. |
| n | = | sample size. |
Figure 9.1 shows the sequence of operations needed to calculate the standard deviation for proportions with the Sharp series of calculators .
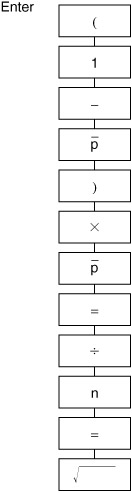
Figure 9.1: The steps for calculating the standard deviation for proportions.
The average sample size (nbar) may be substituted for n in the formula when the subgroup sample sizes are unequal . Use the formula below to calculate n.
nbar = n · k = ( n 1 + n 2 + ‹ n k ) · k
where
| nbar | = | mean sample size |
| n | = | sum of all sample sizes |
| k | = | number of sample sizes used in the formula |
5. Calculate Control Limits (UCL and LCL)
The upper control limit (UCL) and the lower control limit (LCL) are boundaries of common variation. They are calculated as three standard deviations above and below the process center line.
| UCL p | = | pbar + 3 ƒ p |
| LCL p | = | pbar - 3 ƒ p |
where
| UCL | = | upper control limit |
| LCL | = | lower control limit |
| pbar | = | process center line (mean defective rate) |
| ƒ p | = | standard deviation for proportions |
A negative control limit may be calculated for the LCL when the sample proportion of defectives (pbar) is low or the sample size ( n ) is small. Under these conditions, the lower control limit does not exist. Finding no defective parts is expected for this sampling plan.
6. Determine the Vertical Scale for the P Chart
Determine the vertical scale for control charts only after calculating the process center lines and the control limits. If the scale is determined before these calculations, the process center line may be far from its expected position (the center of the chart). In addition, the control limits may be located beyond the range of the chart's scale. The vertical increments should be selected so that the plotting of the sample points is relatively simple and easily understood. The pbar value should be located about one third to one half of the distance up the vertical scale of the p chart. The UCL p should be positioned approximately two thirds to three fourths of the distance up the scale.
7. Plot the Proportions on the Control Chart
Plot the p values for each sample on the chart. Place each plotted point directly above the data and time sequence information included in the data table. The plotted points may be connected with a solid line as an aid to the analysis of patterns and trends in the data. Proofread the plotted points and compare them with the calculated proportions before analyzing the control chart.
8. Draw the Process Center Line and Control Limits on the Chart
The pbar line should be drawn as a solid horizontal line. A control limit is usually drawn as a dashed, bold, horizontal line. Date and label all lines. During the initial study phase, the lines are considered trial center line and control limits. These may require revision as the process is modified and improved.
9. Analyze the p Chart for Process Control
Use the five criteria for process control to evaluate the p chart. Identify and note all out-of-control conditions and factors that contribute to instability. In the process log, note the time, shift, date, material lot number, material vendor, process parameters, and process personnel included in the entire operation during the out-of-control period. The problem-solving techniques included in Chapter 2 will help the identification of special causes of variation.
-
Are there one or more point(s) beyond the control limits?
-
Are there runs of seven (7) or more points?
-
Are there trends of seven (7) or more points?
-
Are there cycles of points?
-
Is there unusual variation (the 1/3 or 2/3 rule)?
If all of the plotted data on the p chart are within the control limits and randomly distributed around the center line, the defective rate for the process is stable and predictable (see Figure 9.2). The process is in control. Unless the process is in control, ongoing control limits cannot be calculated, process capability cannot be studied, and experimental studies cannot be generalized to longer and larger production runs.
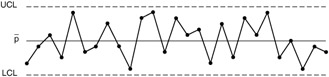
Figure 9.2: A stable and predictable process.
If any of the plotted proportions ( p ) are outside of the control limits (see Figure 9.3), this indicates one or more of the following:
-
The control limits have been miscalculated or have been drawn incorrectly.
-
The plotted proportion beyond the control limit has been miscalculated or plotted improperly.
-
The process defective rate has changed significantly from that of the past (and the cause for the process change must be identified and investigated).
-
The measurement systems or the definition of a nonconforming part has changed.
-
The process center line calculated from these data is questionable because the center line is influenced by extreme variation.
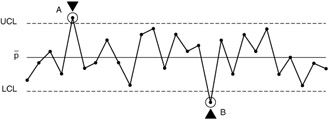
Figure 9.3: A process with out-of-control points.
If there is a run of seven or more proportions ( p ) on one side of the center line (see Figure 9.4), this means one or more of the following:
-
The process defective rate has changed (or is still different) from that of the past,
-
The measurement system or the definition of a nonconforming part has changed.
-
The control limits calculated from these data are questionable and may require recalculation.
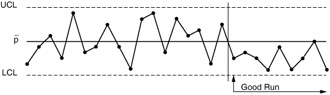
Figure 9.4: A process with a run below the average.
A trend (up or down) of seven or more sample proportions (see Figure 9.5) means that the process defective rate is gradually changing or drifting. The cause of the change must be identified and assessed. Undesirable upward trends must be eliminated from the manufacturing process. Trends that are due to process improvements (downward trends) must be continued . The process should be made stable and predictable at a new and lower level. The process center line, control limits, and capability analyses must be recalculated after the process is controlled at a new level.
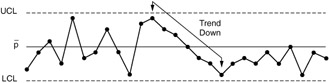
Figure 9.5: A process with a downward trend.
Cycles indicate repeating patterns of high and low process defective rate (see Figure 9.6). These are opportunities for improvement because a number of defective rates have been observed . The factors which cause the different levels of the cycle and the optimal condition ( lowest parts of the cycle) must be identified. The defective rate resulting from the optimal conditions must be made the regular level for the process.
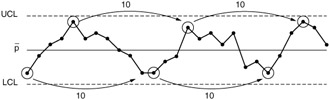
Figure 9.6: A process with cycles.
Unusual variation (see Figure 9.7) in the process defective rate means any or all of the following:
-
The control limits have been miscalculated.
-
The center line for the control chart has been miscalculated.
-
The process or sampling plan is stratified.
-
The data have been edited or changed from the original readings (excessive rounding errors).
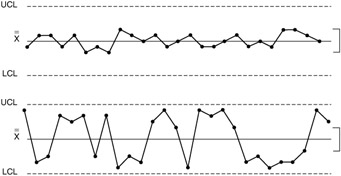
Figure 9.7: A process with unusual variation.
10. Identify and Eliminate the Special Causes of Variation
How people react to control chart signals is the most critical part of the SPC program. To identify and eliminate special variation, people must analyze the process operations and the resources used. In addition to the control chart, fishbone diagrams, Pareto charts, process flow charts, and controlled experiments may be needed to identify and resolve factors which create instability in the process. It is very important to react promptly to eliminate and prevent special causes of variation. A production department's reaction to out-of-control conditions indicates its commitment to understanding and controlling the manufacturing process. The control chart provides signals to help production departments maintain good quality.
11. Extend the Control Limits for Ongoing Process Control
When the data from the manufacturing process (at least 25 subgroups) are consistently within the control limits and in control, the control limits may be extended to future samples of data. Production operators and supervisors should monitor the charts closely and act promptly to correct special causes of variation. If the process is improved, or if extreme sources of variation are eliminated, the process center line and control limits may no longer be appropriate. The changes made to the process may make it necessary to recalculate the process center lines and control limits. When a production department continually improves its operations, control charts require frequent recalculation. The improvement activities are recorded on p charts as downward trends and/or runs below pbar. These out-of-control conditions verify that the process has been improved.
EAN: 2147483647
Pages: 181