CONTROL CHART FORM
CONTROL CHART "FORM"
A control chart is a visual representation of the behavior of the process. As a consequence, the collected data (raw information) are recorded in preformed forms that facilitate both the calculations (average, range, and so on) and the presentation of the data in the form of the control chart.
The forms are practically identical to each other. However, depending on the control chart that one uses, the appropriate and applicable identification characteristics must be checked or written on it. In this section, we are going to explain in detail the parts of a typical control chart ” especially those used for the Xbar and R chart. Our discussion will be based on Figure 7.3, which is a typical Xbar and R chart form. This form may also be used for other charts as well, provided that some of the information on the header is modified.
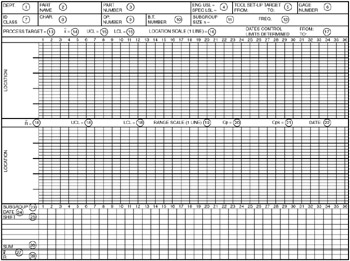
Figure 7.3: A typical Xbar and R chart form. Note that the form is coded with numbers 1 through 28. Each number is explained in the key.
Key to figure:
-
- DEPT: Department number
-
- PART NAME: Name of part made at this operation/station
-
- PART NUMBER: Blueprint part number
-
- ENG. USL = Engineering specification Upper Spec Limit; ENG. LSL = Engineering specification Lower Spec Limit
-
- TOOL SET-UP TARGET: Zone established for set-up verification
-
- GAGE NUMBER: Number of gage used to measure the part characteristic to be charted at this operation/station
-
- ID: Characteristic ID number; CLASS: Classification of characteristics: (CC) - Critical characteristic which affects compliance with government regulations (identified by an inverted delta ( ˆ ) on Ford product engineering blueprint); (SC) - Significant characteristic of products, processes, and tests, where reduction in variation, within a specific tolerance, around a proper target will improve customer satisfaction; (HIC) - High impact characteristic that when outside of the specification tolerance, severely affects subsequent manufacturing operations or customer satisfaction; (OTHER) - All characteristics not classified as CC, SC, or HIC.
-
- CHAR: Written description of dimension being measured
-
- OP. NUMBER: Operation number
-
- B.T. NUMBER: Machine brass tag number
-
- SUBGROUP SIZE: Number of parts to check for charting purposes
-
- FREQ: Frequency - Number of subgroups to be checked for charting purposes
-
- PROCESS TARGET: Zone within "blueprint specifications" that optimizes process capability and produces the fewest rejects
-
-
 : The average of the subgroup averages
 -
- CONTROL LIMITS - The width of process target, determined by the process performance. UCL = upper control limit; LCL = lower control limit (control limits are not to be confused with specification limits)
-
- LOCATION SCALE (1 LINE): The value of each line on a chart
-
- DATE CONTROL LIMITS DETERMINED: The time period during which the calculations were performed
-
-
 : Range-process variability over time; Control limits - The width of process target, determined by the process performance. UCL = upper control limit; LCL = lower control limit (control limits are not to be confused with specification limits)
 -
- RANGE SCALE (1 LINE): The value of each line on a chart
-
- Cp: Process potential index
-
- Cpk: Process capability index
-
- DATE; Date when Cp and Cpk were last calculated
-
- SUBGROUP: A group of measurements
-
- DATE; Date measurements were taken
-
- SHIFT: Shift measurements were taken
-
- SUM: Total of subgroup measurements
-
-
 : Mean - Total of a subgroup measurements (SUM) divided by number of measurements
 -
- R : Range - The difference between the highest measurement and the lowest measurement
EAN: 2147483647
Pages: 181