Chapter 6: Process Variation and Control Charts
In any work environment, no matter how well a process is designed or maintained , there will be a certain amount of inherent or natural differences in the parts , services, or process settings. This natural variation is the cumulative effect of many small and sometimes uncontrollable causes, for instance, the floor shaking, the air circulating , air pressure changing, and so on. As long as these differences remain small, we consider them acceptable for the process. In fact, from a process control point of view, this variation is often called a "stable system of chance causes" or "common variation." A process that is operating with ONLY this common variation present is said to be in statistical control. In this chapter, we discuss the variation, and then we discuss the theoretical basis for control charts because the major objective of SPC is to quickly detect the occurrence of special causes so that investigation of the process and corrective action may be taken before too many rejects are produced.
OVERVIEW
Certain differences between parts or process settings are expected for all work environments. No matter how well a process is designed or maintained, differences (variation) are inherent in repetitive operations. This natural variation is the total effect of many causes (i.e., the floor shakes, air circulates, air pressure changes, material, people, and method vary, etc.). These differences are built into the manufacturing and nonmanufacturing systems and are described by the range of a histogram or frequency polygon (see Figure 6.1).
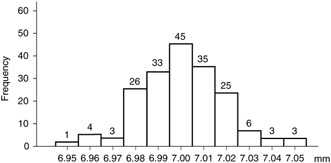
Figure 6.1: A typical natural variation of a process.
A control chart, on the other hand, is a set of mathematical limits applied to a sequence of observations representing a given process. The data comprising each individual observation are random, but the points themselves are plotted in some deliberately chosen , nonrandom arrangement selected to represent the most important variable. It turns out that the most important variable is time. The points, therefore, are plotted in the order of time; that is, in the order of sequence, production, or testing. Where a process study is to be broken down by subgroups, the subgroups constitute an important variable, and therefore the points are plotted by these subgroups.
What does the control chart do? It tests the arbitrary or nonrandom arrangements of points to determine whether they behave as if they were random. If the plotted points indicate nothing but randomness, this tends to show that the variable that formed the base of the arrangement is not an important (or, statistically speaking, significant) variable.
On the other hand, if the points indicate that nonrandomness has entered the data, this tends to show that the variable on which the arrangement was based is actually a significant variable.
EAN: 2147483647
Pages: 181