TRENDING PROCESSES AND CONTROL CHARTS
TRENDING PROCESSES AND CONTROL CHARTS
Some processes are designed so that a general movement or trend in a measured characteristic is expected. The movement may be observed in either a product characteristic (product specification) or a process parameter (machinery setup). As parts are produced, grinding wheels erode, cutting tools wear, and alcohol evaporates from flux. Each of these is an example of a process that is expected to change gradually and in a predictable manner. As the cutting edge is worn, the parts change. Outside diameters get larger, and inside diameters become smaller. As time passes and alcohol evaporates, the specific gravity of flux becomes greater.
The gradual trend that is designed into the process is part of common variation because it is expected, planned, predictable, and a constant source of change. Control charts that are constructed for trending processes must be modified to reflect the gradual trend. The control chart illustrated in Figure 14.13 has been modified correctly. The center line for the Xbar chart slopes so that it describes the gradual increase in the measured characteristic. This is the only major difference between the modified and regular Xbar and R charts. The control limits are drawn parallel to and spaced 3 standard deviations from the control chart center line. The control limits for this chart are based on the same theory as that used for the regular Xbar and R chart. The data shown in Figure 14.13 are in control.
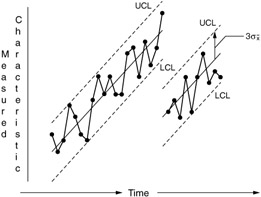
Figure 14.13: A process with modified control limits and in control.
COMMON VARIATION
Because the trend of the process is included in the construction of the control chart, the definitions of common variation and an in-control process must be modified. Common variation is always present and is built into the manufacturing system. It is a system of chance causes of variation. When only common variation is present, the process (including the trend) is predictable and repeatable. However, when in control, trending processes are not stable. In fact, the trend or gradual change is expected. A trending process changes at a predictable rate and allows estimation of a measured value at a future point in time. The rate of change (slope of the trend line) should be repeatable, consistent, and stable. This does not mean that the process is stable. The measured product characteristic or process parameter change with time. The factors that contribute to common variation, including the cause for the general trend, should be stable, repeatable, and predictable.
SPECIAL VARIATION
Special variation and out-of-control signals are not a designed part of the manufacturing system. This is a form of unexpected change in one or more of the manufacturing system components (i.e., machinery, materials, methods , measurements system, personnel, environment, etc.). Special causes of variation can usually be traced to a single factor. A process that includes special variations is out of control. No single population curve can represent this operation because it changes in an unpredictable manner. When it is out of control, people cannot expect or estimate a measured value at a future point in time.
The Xbar and R chart with a trending center line should be analyzed with all of the typical criteria. The range chart should be in control and stable. Rbar should be small enough that the estimated distribution for the population at any instant of time fits well within the specification limits. Short- term estimates of capability should show more than ±4 standard deviations within the product specifications (C pk > 1.33). This technique cannot be used if the short-term capability level does not surpass the customer's wants.
The Xbar chart should be analyzed by asking if there are any of the following:
-
Any points beyond the control limits?
-
Any runs of seven (7) or more points on one side of the center line?
-
Any change in the slope of the center line?
-
Any cycles or repeating patterns?
-
Any unusual variation?
Each of these signals should be identified on the control chart and investigated. Out-of-control signals do not mean that the process is worse . Out-of-control signals simply indicate change or a difference from the previously established process. Any significant improvement requires a major change to the process. This should be reflected on the control charts as an out-of-control signal.
TRENDING PROCESSES AND CAPABILITY
Processes that have a trending center line are allowed to drift until the distribution of parts approaches the product specification limit. The trend is tolerated only as long as the needed level of capability does not become violated. Although the trend or drift is expected and part of the process, the gradual movement cannot be ignored and allowed to generate defective (out of specification) product. A set of safety limits defines the boundaries of acceptable drift for trending processes. These limits protect the capability level of trending processes. As long as the process is set up and adjusted within the safety limits, the capability level of trending processes can be guaranteed .
The curves illustrated in Figure 14.14 show the derivation of safety limits. The capability requirements for the process were defined as at least ±4 standard deviations (99.994% good parts) within the product specifications. The curve illustrated in Figure 14.14A fulfills the capability requirements because the mean is more than four standard deviations from either specifications limit. The process is expected then to drift so that the mean becomes higher and closer to the upper specifications limit (USL). The curves in Figure 14.14B show the process at different points in time. Each of the curves fulfills the capability requirements. The curve with the highest mean (the curve farthest to the right) meets the minimum capability requirement. The mean for this curve is exactly 4 standard deviations from the USL. If the process is allowed to drift closer to the USL, the manufacturing process would no longer meet the definition of capability. The mean of this curve is the maximum safe process average (MaxSPA) limit. This safety limit is set by measuring the capability requirement (four standard deviations away from the product specification). The minimum safe process average (MinSPA) limit is also determined by the distance from the lower specification limit (LSL) that equals the capability requirement. Figure 14.14C. shows both the MinSPA and the MaxSPA limits.
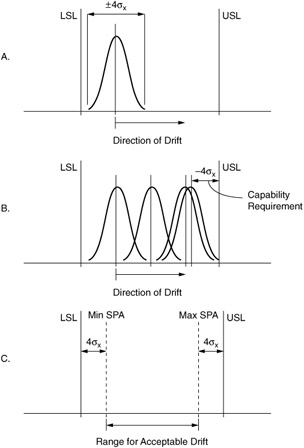
Figure 14.14: Curves illustrating the derivation of safety limits.
| Note | The MinSPA and the MaxSPA are lines that guarantee the capability of the process. These limits are based on the capability requirements and the size of the short-term process standard deviation. These are not control limits. Control limits are based on the process center line and a measure of common variation, A 2 — Rbar. The safety limits should not be confused with control limits. The lines should be labeled and drawn differently from the dashed lines that are used to represent control limits. The different graphical representation and labels should help avoid confusion between control and safety limits established. If the process center line crosses the safety limits, the capability requirements are violated, and an unacceptably high percentage of parts is being made outside of the specification limit. |
The area between the safety limits is a range within which the process mean may drift and still fulfill the capability requirements. The time that is needed by the process to drift from the MinSPA to the MaxSPA limit is the life of the process or setup. As soon as the mean or the center line of the process reaches either, the safety limits are drawn on the Xbar chart by measuring the distance equal to the capability requirement (four standard deviations from each of the specification limits; see Figure 14.15). The process is capable as long as it is operated so that the center line of the process begins and ends within the safety limits. The first trending process shown in Figure 14.15 was begun so that the center line was right on the MinSPA. This is the lowest possible place to setup the manufacturing operation. If the setup were made any lower, too many parts would be made below the lower specification limit. The process was allowed to drift higher, until the center line crossed the MaxSPA. In fact, the process was operated for some time while the center line was higher than the MaxSPA. This means that the process was not meeting the capability requirement; too many parts were being made oversized. The process centerline was allowed to run too close to the USL. The process should have been adjusted one sample group earlier. If it had been adjusted earlier, the capability requirements would have been met.
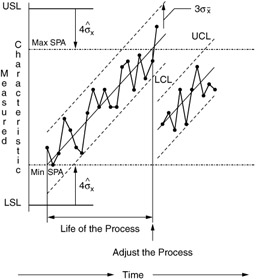
Figure 14.15: A trending process with MinSPA and MaxSPA.
The second trending process shown in Figure 14.15 is capable. The process was set up so that the center line was above the MinSPA limit. If the process were stopped with the last sample group, the center line would be kept below the MaxSPA limit. This process would be capable if the operation had been stopped and adjusted when the center line crossed the MaxSPA limit.
The life of the process or setup is shown in Figure 14.15 according to the time (or the number of machine cycles) that is needed for the center line to cross the MinSPA and the MaxSPA limits. The duration of the process life is dependent on the following:
-
The level of capability required of the process ( ±3, 4, 5, or 6 standard deviations)
-
The size of the short-term standard deviation of individual parts
-
The slope or angle of the center line
Steps for constructing an Xbar and R chart with a trending center line (you may want to review the section on "tool wear" in Chapter 10): The data listed in Table 14.1 were collected during the summer of 2000. The measurements are outside diameters for a windshield wiper motor armature shaft. The subgroups ( n = 3) were collected every 10 minutes. The lower specification limit was equal to 0.3720 inches, and the upper specification limit was equal to 0.3730 inches. The data in the table have been coded so that only the last two digits are listed. Using this code, the measurement .3722 is listed as 22, the LSL = 20, and the USL = 30.
| Xbar | R | |||
|---|---|---|---|---|
| 21 | 22 | 23 | 22.0 | 2 |
| 22 | 22 | 23 | 22.3 | 1 |
| 23 | 24 | 24 | 23.7 | 1 |
| 23 | 24 | 24 | 23.7 | 1 |
| 24 | 24 | 25 | 24.3 | 1 |
| 24 | 25 | 25 | 24.7 | 1 |
| 24 | 25 | 26 | 25.0 | 2 |
| 25 | 26 | 27 | 26.0 | 2 |
| 22 | 22 | 23 | 22.3 | 1 |
| 23 | 24 | 24 | 23.7 | 1 |
| 23 | 24 | 24 | 23.7 | 1 |
| 23 | 24 | 24 | 23.7 | 1 |
| 23 | 24 | 25 | 24.0 | 2 |
| 23 | 23 | 23 | 23.0 |
|
| 24 | 24 | 25 | 24.7 | 1 |
| 26 | 26 | 27 | 26.3 | 1 |
| 21 | 22 | 23 | 22.0 | 2 |
| 22 | 22 | 23 | 22.3 | 1 |
| 22 | 23 | 23 | 22.7 | 1 |
| 23 | 23 | 24 | 23.3 | 1 |
| 24 | 24 | 25 | 24.3 | 1 |
| 23 | 24 | 25 | 24.0 | 2 |
| 24 | 25 | 25 | 24.7 | 1 |
| 25 | 26 | 27 | 26.0 | 2 |
-
Calculate the mean and range for each sample subgroup. The mean and range for each sample subgroup are listed in Table 14.1.
-
Construct an R chart. The steps for constructing an R chart are presented in Chapters 8 and 10. The factors and formulas for calculating control limits are listed in Table 8.1.
-
Analyze the range chart by asking:
Are there points beyond the control limits?
Are there runs of seven (7) or more points on one side of the center line?
Are there increasing or decreasing trends of seven (7) or more points?
Are there cycles or repeating patterns in the data?
Is there unusual variation in the plotted ranges?
-
Determine a scale for the Xbar chart. Create a vertical scale for the Xbar chart. The scale should include the upper and lower specification limits.
-
Plot the sample means on the Xbar chart.
-
Draw the center line on the Xbar chart. Draw a line of best fit through the center of each trending process. The trend line should have as many means above as below it. (The least-squared error line may be calculated as the line of best fit. Although this line is technically correct, visual approximations of the center line are usually sufficiently accurate to provide signals of special variation.)
-
Draw control limits on the Xbar chart. Control limits for the Xbar chart are placed 3 standard deviations of means from the process center line. This is the same distance that is used for the regular Xbar chart. The distance is calculated with the following formula:
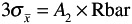
where

=
3 standard deviations for means
A 2
=
factor for calculating control limits (found in Table 8.1)
Rbar
=
the center of the range chart or the mean of the sample ranges
Measure the distance for the control limits vertically above and below the process center line. Measure the distance at two or more points so that the control limits may be drawn parallel to the center line. Draw the control limits with a dashed line.
-
Analyze the Xbar chart. Assess the predictability of the manufacturing process location by asking:
-
Are there points outside a control limit?
-
Are there runs of seven (7) or more points on one side of the center line?
-
Are the center lines sloped at equal angles?
-
Are there cycles or repeating patterns in the data?
-
Is there unusual variation in the plotted data?
-
-
Calculate the safe process average limits. The short-term standard deviation for individual parts is estimated with the following formula:

where

=
the estimated short term standard deviation for individual parts
Rbar
=
the center line of the range chart of the mean of the sample ranges
d 2
=
the divisor for estimating standard deviations from ranges (found in Table 8.1)
The capability requirements define how many standard deviations of individuals are used to calculate the safety limits (MinSPA and MaxSPA). The level of capability must reflect the customer's wants. For this example, a capability requirement of ±4 standard deviations (at least 99.9945% good parts) is assumed. Calculate the numbers of standard deviations defined by the capability requirement and measure this distance inside the specification limits. The following formulas are used to calculate the safety limits:
MinSPA
=
LSL +

MaxSPA
=
USL -

where
MinSPA
=
minimum safe process average limit
LSL
=
lower specification limit

=
estimated short-term standard deviation of individuals
MaxSPA
=
maximum safe process average limit
USL
=
upper specification limit
-
Draw the safety limits on the Xbar chart. The safety limits (MinSPA and MaxSPA) must not be confused with control limits. Safety limits are based on the capability requirements, the short-term standard deviation, and the product specification limits. Control limits are based on the process center line and an estimate of common variation. Label the safety limits and draw them with a dashed line that is different from that used to draw the control limits.
-
Analyze the capability level. Assess the observed trending processes by comparing the center lines with the safety limits. If the center line begins and ends within the safety limits, the process is capable. If the center lime continues beyond the safety limits, the capability requirements have not been fulfilled. Determine the appropriate setup and adjustment values (MinSPA and MaxSPA) and use these for future production.
-
Estimate the life of the process. Extend the center limes of a trending process so that it crosses both of the safety limits. Measure the time (or number of machine cycles) between the intersection of the center line and the safety limits. This time period is the life span of the process or setup. The manufacturing system should be organized to adjust and attend to the process with this frequency.
EAN: 2147483647
Pages: 181