COST OF QUALITY
The purpose of costs in quality is to establish "the method" for collecting, maintaining, and using quality cost data so that they become the conscience (the driving force) of the organization for continual improvement. Once this conscience has been realized, then a real effort is put in place in the area of quality improvement opportunity (QIO) for quality audit, product procedures process, and the overall system.
This is based on the notion that "quality" is defined as satisfying the customer's needs. How does the cost of quality/quality improvement opportunities satisfy the customer's needs through the manufacturing organization? See Figures 10.1 and 10.2.
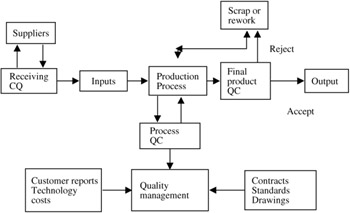
Figure 10.1: Quality cost ” The quality control system.
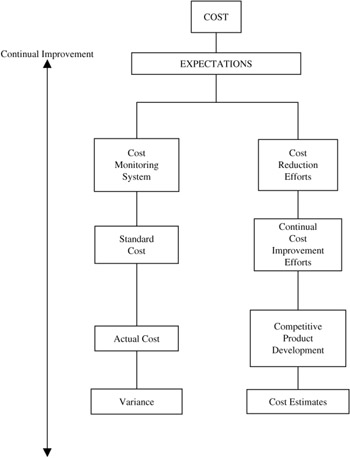
Figure 10.2: Costs.
COST MONITORING SYSTEM
An organization is expected to use methods that accurately monitor all cost elements. The cost of doing business (labor, materials, overhead) cannot be effectively controlled without a systematic method that effectively monitors how costs are incurred. Specifically , the organization should develop costs relative to quality that will serve as a guide for measuring plant efficiency.
Standard Cost
The organization should develop a method that will allow for efficiency in labor (direct and indirect); identification of material content ( parts and components ); appropriate measures of overhead; and documentation/development, review, and revision of these standards.
Actual Costs
A supplier should maintain an accurate system to record, monitor, and control labor, material and overhead costs. For example:
-
Compute labor efficiency reports for a period.
-
Establish a tolerance limit for efficiency.
-
Ensure that reports are received by management.
-
Generate monthly summary reports.
-
Ensure that raw materials are ordered in economical quantities to reduce and/or control the cost of material.
-
Develop a system that will track materials on hand.
-
Budget for overtime.
-
Charge premiums to the applicable departments as overhead.
-
Charge straight time portions as direct labor.
-
Perform surveys to accurately analyze and distribute indirect inventory overhead and service department costs.
-
Provide adequate records for support.
Variance
A supplier should be able to identify and control cost variances. For example:
-
Cost comparison report: Reviewed by the responsible departments in predefined cycles weekly, monthly, etc.
-
Tolerance limit: A system to address the variance and provide for appropriate action.
-
Plant report: A regular reporting of costs and variance published and reviewed by management.
-
Level of comparison: A specific level appropriate for the commodity being produced (part number, department, cost center, etc.).
Cost Reduction Efforts
The organization and the supplier should cooperate fully with each other in an effort to reduce costs. Continuous efforts to reduce costs and therefore selling price are essential for the organization and the supplier, if both are to remain competitive in the market place. For a supplier to reduce costs, the efforts should be directed in the following areas:
-
Continual improvement program
-
Competitive product development and target cost achievement
-
Cost estimates
CONCEPTS OF QUALITY COSTS
All the gurus of quality have identified the costs as an essential part of overall quality improvement. In a summary format let us see some of them:
J. Juran
Among other concerns, Juran emphasizes that
-
Quality is an issue of cost.
-
To control cost, management must be equipped with experience and training.
-
Quality cost must become a part of the strategic business plan of the organization.
W.E. Deming
Perhaps one of the most prolific gurus in quality issues of the 20th century, Deming spent a lifetime explaining the issue of cost as one of the driving forces in a dynamic organization by always explaining the need to end the practice of awarding business on the basis of price tag, eliminate numerical goals, and eliminate work standards.
P. Crosby
Crosby was by far the best salesperson of quality. He was the first to associate the bottom line with the effect of costs. He made a point of differentiating quality of conformance and nonconformance , to quantify the waste of poor quality as a per cent of sales, push for the concept of zero defects and the attributes of prevention quality as opposed to appraisal.
G. Taguchi
Taguchi's contribution to the cost of quality is with the tolerance design cost accountability on specifications setting and the loss function.
DEFINITION OF QUALITY COMPONENTS
Depending on whom you listen to, approximately 6 to 15% of all quality problems are related to special causes (labor). The other 85 to 94% arise from faults in the company's system. This larger percentage will continue until management changes the system. Both special and local issues are contributors to the cost of quality (CQ). Two questions follow:
What is really meant by "quality cost"?
What are the steps of quantifying the costs?
-
There are two major categories of quality costs.
-
Inputs
-
Outputs
The inputs are made up of the appraisal costs, which are the costs incurred (first time through), to discover the condition of the product. These include
-
Incoming material inspection
-
Inspection and test
-
Maintaining accuracy of test equipment
-
Materials and services consumed
-
Evaluation of stocks
-
Product quality audits
Another component of the inputs to quality costs is the prevention cost. These are costs incurred to keep output and appraisal costs to a minimum. They include:
-
Quality planning
-
New products review
-
Training
-
Process control
-
Quality data requisition and analysis
-
Quality reporting
-
Improvement projects
-
Other prevention costs (general office expenses)
The outputs are made up of the internal failure costs. These result when quality issues are discovered outside an organization by the customer. They include
-
Scrap
-
Rework
-
Retest
-
Downtime
-
Yield losses
-
Disposition
-
Failure analysis
-
Fault of suppliers
Another component of the outputs is the external failure costs, which are
-
Complaint adjustment
-
Returned material
-
Warranty changes
-
Allowances
-
Repair
-
Errors
-
Liability
-
-
The use of cost of quality can be quantified by giving attention, prioritizing, justifying, recognizing, and driving decision making deeper into the organization. Screening the costs throughout the organization occurs through:
-
Analyzing the ingredients of established accounts
-
Resorting to basic accounting documents
-
Creating records for documentation
-
Estimating costs using statistical tools
The analysis of these four categories can be performed by various means, i.e., through descriptive statistics, graphical techniques, or advanced statistical analyses.
Here we must emphasize that cost of quality is not a system that encourages, fortifies, or perpetrates the adversary position of one department against another or one company against another. Rather, it is a system that allows management to look at a specific situation compared against itself over time. The ultimate in this thinking is planning for growth. The relationship among CQ, planning, growth, and quality is heavily dependent upon management's attitude and the employer involvement improvement opportunity of a given organization. The underlying assumption of this concept is that as one controls quality, one reduces cost and this increases profit. This assumption of CQ is important because it becomes the catalyst that causes management to address the issue of quality. Profit is the universal language of all management. The question becomes: "What does CQ provide to management that serves as a significant indicator to them?" It provides:
-
A systematic method of assessing the overall effectiveness of the quality program
-
A means of establishing programs to meet overall needs
-
A method of determining problem areas and action profiles
-
A technique to determine the optimum amount of effort for each of the various quality activities
-
METHODS OF MEASURING QUALITY
The operating quality costs of prevention and appraisal are considered to be controllable quality costs, while the internal and external failure costs are uncontrollable. Juran has demonstrated the relationship between the controllable and uncontrollable QC curves and the direct quality cost curve over time. As the controllable costs of prevention and appraisal increase, the uncontrollable costs of internal and external failure decrease. The point where the cost of preventing and appraising exceeds the cost of correcting the product failure is the optimum operating quality cost. Mathematically, the optimization is:
| Let f(q) | = | total (internal and external) failure costs |
| p(q) | = | total (appraised and prevention) prevention costs |
| T(q) | = | total quality costs = f(q) + p(q) |
| q | = | quality level (0 to 100% good product) |
| T(q) | = | dT/dq = 0 or dp/dq = df/dq, which is the minimum |
This means that an additional dollar invested in prevention will produce exactly one dollar's worth of reduced failure costs. Below the optimum it provides more than one dollar and above the optimum the opposite is true. Therefore:
-
Optimum quality depends on incremental not total elementary costs.
-
There is nothing that demands the optimum be at q = 100%. There might be a minimum rather than an optimum, and it could very well be at q = 100%.
The optimum (minimum) quality cost could lie at zero defects, q = 100%, if the incremental cost of approaching zero defects is less than the incremental return from the resulting improvement. Juran asserts that prevention costs rise asymptotically, becoming infinite at 100% conformance. This implies that the incremental cost is also infinite. Since the incremental return is not, it follows from his assertion and the above mathematics that the optimum lies below 100%. The question is: Does it really take infinite investment to reach zero defects?
For Crosby, on the other hand, the cost of quality bases are:
-
Total contract sales
-
Total cost
-
Manpower
-
Manpower by skill
-
Budgeted costs
-
Income after taxes
-
Operating profit
-
Equity earnings
-
Strategic managed cost
-
Constant dollars
COMPLAINT INDICES
The user costs associated with failures can be grouped into five categories.
R = repair cost
E = effectiveness loss (idle labor)
C = extra capacity required because of product downtime
D = damage caused by failure
L = lost income (profit)
If these costs are measured each year over the life of the product, then the failure cost (C f ) is
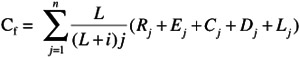
where n = life of the product and i = the yearly interest rate.
PROCESSING AND RESOLUTION OF CUSTOMER COMPLAINTS
-
Satisfying the complaint
-
Preventing a recurrence of isolated complaints
-
Pareto analysis
-
An in-depth analysis of the vital few
-
Further statistical analysis
TECHNIQUES FOR ANALYZING DATA
-
The seven tools of total quality costs
-
Pareto chart
-
Course and effect diagram
-
Stratification chart
-
Check sheet
-
Histogram
-
Scatter plot
-
Graphs and control charts
-
-
Defect matrices
-
Cost analysis
-
Spare parts use growth curves
-
Probability paper
-
Simulation studies
-
Statistical modeling
-
Abnormality control chart. The abnormality chart is a chart that addresses the following questions/concerns:
-
How did it happen?
Date:
Place:
Lot number:
Item name :
Found By:
Description:
-
How it was found?
-
Emergency measure taken
-
Investigation of the causes
-
Cause(s)
-
Measures taken to prevent recurrence
-
How will these measures affect similar processes?
-
How to proceed next ?
-
-
FORMAT FOR PRESENTATION OF COSTS
| Type of Standard | Standard is Based on | Managers Use the Report to Answer the Question |
|---|---|---|
| Engineered | Studies made by engineers , e.g., material usage, labor hours | Are we attaining the results that the engineering studies showed were obtainable? |
| Historical | Statistical computation of past performance | Are we getting better or worse ? |
| Market | Market studies to discover performance of competitors | Were do we stand compared to our competitors? |
| Planned | Broad program of final results needed and allocation to subprograms, e.g., reliability goals | Are we going to be able to attain the overall planned goal? |
This format must serve as a catalyst to management to provide attention, prioritization, justifications, recognition, and corrective action.
LAWS OF COST OF QUALITY
-
We cannot reduce cost without affecting quality.
-
We can improve quality without increasing cost.
-
We can reduce cost by improving quality.
-
Cost of quality drives the system.
-
If quality costs money, do not do it.
DATA SOURCES
Typical sources for cost of quality (CQ) are:
| Types of Data | Sources |
|---|---|
| Field performance data | Customer service department |
| Trend of sales by model customer, etc. | Internal sales analysis |
| Trends of competitor activities, dealer reactions , and other "field intelligence" | Reports of field sales force |
| Extent of field replacements due to failures in service | Sales of spare parts |
| Competitive quality ratings | Customers who buy from multiple sources |
| Independent quality ratings | Independent laboratories |
| Results of research on quality research | Government departments; institutions |
| Cost summary | Monthly quality cost report ” see Table 10.4 |
| October | Year to Date | |||
|---|---|---|---|---|
| Actual | Variance | Category | Actual | Variance |
| ||||
| 18.3 | 3.2 |
| 190.1 | 10.1 |
| 4.6 | 0 6 |
| 61 8 | 7.5 |
| 2.6 | 0.9 |
| 207 | 7 3 |
| 7.3 | 2.1 |
| 46.8 | 20.3 |
| 2.4 | 3.4 |
| 312 | 25.0 |
| 35.2 | 10.2 | Total prevention cost | 350 6 | 55 2 |
| 7.7% | % of total quality cost | 9.4% | ||
| ||||
| 9.6 | 1.8 |
| 87.3 | 7.1 |
| 32.5 | 15.4 |
| 323.0 | 105.0 |
| 14.1 | 27.4 |
| 140.9 | 269.7 |
| 1.4 | 1.1 |
| 16.5 | 8.8 |
| 4.1 | 1.6 |
| 23.4 | 0 0 |
| 61.7 | 9.7 | Total appraisal cost | 591.1 | 166.4 |
| 13.5% | % of total quality cost | 15.9% | ||
| 9.6 |
| |||
| 14 6 | 124.3 |
| 50.0 | 8.0 |
| 197.2 | 8.1 |
| 1305.6 | 557 6 |
| 25.2 | 2.3 |
| 185.1 | 0.4 |
| 6.8 | 6.6 |
| 88.0 | 3.0 |
| 14.1 | 0.2 |
| 152.1 | 77.2 |
| 0.8 |
| 8.1 | 1 9 | |
| 258.7 | 129.9 | Total internal cost | 1788.9 | 621.5 |
| 56.4% | % of total quality cost | 48.1 | ||
| ||||
| 8.6 | 1.6 |
| 75.3 | 5.3 |
| 41.8 | 1.2 |
| 403.6 | 26.4 |
| 25.6 | 0.3 |
| 256.5 | 3.5 |
| 21.9 | 27.0 |
| 226.6 | 263.4 |
| 4.9 | 4.0 |
| 28.5 | 10.2 |
| 0.0 | 0.0 |
| 0.0 | 0.0 |
| 102.8 | 30.3 | Total external cost | 990.5 | 291.2 |
| 22.4% | % of total quality cost | 26.6% | ||
| 458.4 | 79.7 | Total operating cost | 3721.1 | 108.7 |
| Measurement Bases | ||||
| 6.5 |
| 5.3 | ||
| 8.8 |
| 9.0 | ||
| 16.7 |
| 16.3 | ||
INSPECTION DECISIONS
| What to inspect | Raw materials |
| Processes | |
| Products | |
| When to inspect | Prior to supplier shipment |
| Upon receipt from suppliers | |
| Before start of processes | |
| During processes | |
| Prior to costly processes | |
| Prior to irreversible processes | |
| Prior to covering processes (painting) | |
| After processes | |
| Before shipping to customers | |
| How much to inspect | 100% inspection |
| Sampling inspection | |
| Type of measurements | Variable measurement (continuous) |
| Attribute measurement (discrete) | |
| Who inspects | External suppliers |
| Workers themselves | |
| Quality inspectors | |
| Where to inspect | Work stations |
| Inspection stations | |
| Laboratories |
PREVENTION COSTS (SEE TABLE 10.5)
APPRAISAL COSTS (SEE TABLE 10.6)
INTERNAL FAILURE COSTS (SEE TABLE 10.7)
EXTERNAL FAILURE COSTS (SEE TABLE 10.8)
| Cost Element | Description/Definition | Where to Obtain/ How to Calculate Cost |
|---|---|---|
| All costs (salary and administrative) related to the planning of an effective quality system that translates customer requirements into the manufacturing process; test and inspection planning costs are reported separately (see #2) | Salary budget reports Expense budget reports Estimates Department budget reports (allocated) Time sheets Purchase orders Estimates |
| By other departments
| Allocated costs for time spent in quality planning by personnel not reporting to the quality department | |
| Costs of planning and procuring developing test and inspection equipment (excluding actual equipment costs, which are part of appraisal costs) Development costs for test and inspection processes | Department budget reports (allocated) Purchase orders Estimates |
| Costs for qualifying new products, processes, and equipment (including of test and inspection) to meet customer requirements | Department budgets (allocated) Launch budget (allocated) Purchase orders Estimates |
| All costs for developing, implementing, operating, and maintaining formal quality training (including statistical training) | Training budget Purchase orders Estimates |
| All other costs associated with planning, implementing, and maintaining a quality system not specifically included elsewhere | Estimates Adjustments (including negative costs) |
| Cost Element | Description/Definition | Where to Obtain/How to Calculate Cost |
|---|---|---|
| All costs of inspectors, supervision, lab, and clerical personnel working on incoming material; includes costs to visit or station personnel at supplier locations | Department budgets (allocated) Process sheet standards Inspection sheets standards Estimates |
| Salaries and associated costs of all staff performing in-process inspection and testing either 100% or sampling; includes materials consumed during tests | Same as # 1 |
| Costs of tests, inspection, and lab equipment; equipment maintenance and purchased services also included | Department budgets (allocated) Purchase orders/maintenance contracts Estimates |
| Personnel expenses for performing quality reviews on in-process or finished products | Department budgets (allocated) Estimates |
| Costs incurred in field testing for product acceptance at a customer's site, prior to releasing the product | Field inspection reports Department budgets (allocated) Estimates |
| All other appraisal costs not specifically covered elsewhere | Estimates Adjustments (including negative costs) |
DIAGNOSTIC GUIDELINES TO IDENTIFY MANUFACTURING PROCESS IMPROVEMENT OPPORTUNITIES
-
Identify the process to be evaluated.
-
Become acquainted with the process by reviewing process sheets and through discussion with line supervision.
-
Visit each operation to review for type of cost incurred, appraisal, internal failure, etc.
-
Talk to individual operators to define further what goes wrong at each operation; mis-assembly, wrong tools, poor setup, etc.; note machine numbers, part numbers , and shift.
-
Identify and quantify failures at each operation; scrap, damage, rework, etc., by shift.
-
Use the existing financial system to assign the cost of direct/indirect labor, benefits, material, etc., to each operation within the process.
-
For each operation calculate the cost of scrap, rework, testing, inspection, production checks, sorting, and audits. Also calculate the costs associated with return sales, warranty, and customer loyalty.
Table 10.7: Internal Failure Costs Cost Element
Description/Definition
Where to Obtain/How to Calculate Cost
-
Rework and repair internal fault internal fault supplier fault
Costs of reworking defective product; includes costs associated with the renew and dispositioning of non-conforming purchased products
Cost accounting reports
Detective material reports
Department budgets (allocated)
Estimates
-
Scrap
All scrap losses incurred resulting defective purchased materials/products and incorrectly performing manufacturing operations; costs charged to suppliers are not included; scrap value, less handling charges, may be included as an offset
Salvage reports
Defective material reports
Estimates
-
Troubleshooting and failure analysis
Costs incurred in analyzing non-conforming product to determine causes
Department budgets (allocated)
Problem reports
-
Reinspect and retest
Costs to reinspect or retest products that previously failed
Department budgets (allocated)
Estimates
-
Excess inventory
Inventory costs resulting from producing defective products; includes storage of defective product and added inventory of good product to cover production shortfalls
Cost accounting reports
Department budgets (allocated)
Estimates
-
Design and process changes
Costs to revise a product or process due to production of defective product
Estimates
-
Other internal failure costs/offsets
All other costs related to the production of defective product nor specifically included elsewhere
Estimates
Adjustments
-
-
Sum these costs to obtain the total cost of quality within the process.
-
State this cost as a fraction of the total cost of the process or as a dollar amount that represents the opportunity for improvement in the process.
-
Ensure continuous improvement through ongoing process analysis (plan, do, check, act).
DIAGNOSTIC GUIDELINES TO IDENTIFY ADMINISTRATIVE PROCESS IMPROVEMENT OPPORTUNITIES
-
Identify the process or procedure to be evaluated.
-
Become acquainted with the process or procedure by reviewing instruction sheets and procedure manuals and by generating a unique process flow diagram; discuss with local supervision.
Table 10.8: External Failure Costs Cost Element
Description/Definition
Where to Obtain/ How to Calculate Cost
-
Warranty
All warranty costs that can be allocated to a manufacturing location due to the production of defective product or incoming material; includes internal processing and investigation of warranty
Warrant reports (allocated)
Department budgets (allocated)
Estimates
-
Recalls and product liability claims
All costs associated with manufacturing location fault for recall campaigns or liability claims
Recall reports
Corporate liability settlement reports
Department budgets (allocated)
-
Products returned or rejected
Costs of handling and accounting for defective product returned or rejected by the consuming plant or customer
Department budgets (allocated)
Returned material reports
Sales and service reports
-
Reinspection and retest
Costs to reinspect or retest defective product at the customer's site
Department budgets (allocated)
Estimates
-
Customer and field contacts
Salary and administrative costs to handle meetings, visits , etc. with customer personnel resulting from the receipt of defective product
Department budgets (allocated)
Estimates
-
Design and process changes
Costs to revise the product or process to satisfy the customer who received defective product
Department budgets (allocated)
Estimates
-
Customer goodwill
Extraordinary costs that result from attempting to satisfy a customer whose expectations were not met with previously received defective product
Travel and expense reports
Department budgets (allocated)
Estimates
-
Other external failure costs
All other costs related to defective product reaching the customer not specifically covered elsewhere
Estimates
Adjustments (including negative costs)
-
-
Review each operation for the type of cost incurred; appraisal (checks, reviews, etc.), internal failure (blueprint errors, incomplete forms, etc.).
-
Talk to individual employees to define further what goes wrong at each operation; redundant operations, misfiling, improper direction, delays, etc.
-
Identify and quantify failures at each operation and their effect on subsequent operations.
-
Use the existing financial system to assign the cost of labor and material to each operation.
-
Calculate the cost of losses associated with the items identified in steps 4 and 5.
-
Sum these costs to obtain the total cost of quality within the process.
-
State this cost as a fraction of the total cost of the process or as a dollar amount that represents the opportunity for improvement in the process.
-
Ensure continuous improvement through ongoing process analysis (plan, do, check, act).
STEPS FOR QUALITY IMPROVEMENT ” USING COST OF QUALITY
Procedure
-
Organize the team.
-
Describe the problem.
Estimate the magnitude of quality costs.
Identify the key business processes that have the greatest impact on the costs.
-
Define root causes.
Identify and prioritize the root causes of process problems.
-
Implement interim corrective action.
Establish control of the business process.
-
Implement permanent corrective action.
Improve the capability of the business process.
-
Verify effectiveness of actions.
Measure effect of actions identified in (4) and (5).
-
Prevent recurrence.
Modify management and operating systems, practices, procedures, and processes.
-
Congratulate team.
Examples
Non-manufacturing measurements, which are sometimes difficult to establish, might include the following:
-
Accounting
-
Percent of late reports
-
Computer input incorrect
-
Errors in specific reports as audited
-
Percentage of significant errors in reports; total number of reports
-
Percentage of late reports; total number of reports; average reduction in time spans associated with important reports
-
Pinpointing high-cost manufacturing elements for correction
-
Pinpointing jobs yielding low or no profit for correction
-
Providing various departments with the specific cost tools they need to manage their operations for lowest cost
-
-
Administrative
-
Success in maximizing discount opportunities through consolidated ordering
-
Success in eliminating security violations
-
Success in effecting pricing actions so as to preclude subsequent upward revisions
-
Success in estimating inventory requirements
-
Success in responses to customer inquiries so as to maximize customer satisfaction
-
Decimal points correctly placed
-
Correct calculations in bills, purchase orders, journal entries, payrolls, bills of lading, etc.
-
Time spent in locating filed material
-
Percentage of correct punches in paper used during a given period versus actual output in finished pages
-
-
Clerical
-
Accurate typing, spelling, hyphenation
-
Decimal points correctly placed
-
Correct calculations in bills, purchase orders, journal entries, payrolls, bills of lading, etc.
-
Time spent in locating filed material
-
Percentage of correct punches
-
Paper used during a given period versus actual output in finished pages
-
-
Data processing
-
Keypunch (KP) cards thrown out for error
-
Computer downtime due to error
-
Rerun time
-
Promptness in output delivery
-
Effectiveness of scheduling
-
Depth of investigations by programmers
-
Program debugging time
-
KP (data entering) efficiency
-
-
Engineering: design
-
Adequacy of systems specifications
-
Accuracy of system block diagrams
-
Thoroughness of system concepts
-
Simulation results compared to original design or prediction
-
Success in creating engineering designs that do not require change in order to make them perform as intended
-
Success in developing engineering cost estimates versus actual accruals
-
Success in meeting self-imposed schedules
-
Success in reducing drafting errors
-
Success in maximizing capture rates on RFPs for which the company was a contender
-
Success in meeting engineering test objectives
-
Number of error-free designs
-
Correct readings of gages and test devices
-
Accurate specifications and standards
-
Proper reporting and control of time schedules
-
Reduction of engineering design changes
-
Changes in tests or in illustrations of reports
-
Rework resulting from errors in computer program input
-
Advance material list accuracy
-
Design compliance to specifications
-
Customer acceptance of proposals
-
Meeting schedules
-
Thoroughness of systems concepts
-
Accuracy and thoroughness of reports
-
Adequacy of design reviews
-
Compliance to specifications
-
Adequacy of design reviews
-
Accuracy of computations
-
Accuracy of drawings
-
Reduction in number of engineering non-conformances to correct errors
-
-
Engineering: manufacturing
-
Accuracy of manufacturing processes
-
Timely delivery of manufacturing processes to the shop
-
Accuracy of time study data
-
Accuracy of time estimates
-
Timely response to bid requests
-
Schedule compliance
-
Asset utilization
-
Accuracy and thoroughness of test processes
-
Adequacy and promptness of program facilitation
-
Application of work simplification criteria
-
Minimum tool and fixture authorization
-
Labor utilization index
-
Methods improvement (in hours or dollars)
-
Contract cost
-
Lost business due to price
-
Process change notices due to error
-
Tool rework to correct design
-
Methods improvement
-
-
Engineering: plant
-
Effectiveness of preventive maintenance program
-
Accuracy of estimates (dollars and details)
-
Accuracy of layouts
-
Cost of building services
-
Completeness of plant engineering drawings
-
Adequacy of scheduling
-
Fixed versus variable portions of overhead
-
Maintenance cost versus floor space, manpower, etc.
-
Lost time due to equipment failures
-
Janitorial service
-
Success in meeting or beating budgets
-
Instrument calibration error
-
Fire equipment found defective
-
Lost time due to equipment failures
-
Purchase requisition errors
-
Schedule compliance
-
Timely response to bid requests
-
Adherence to contract specifications
-
Effectiveness of customer liaison
-
Effectiveness of cost negotiations
-
Status "ship not bill"
-
Change orders due to errors
-
Drafting errors found by checkers
-
Late releases
-
Time lost due to equipment failure
-
Callbacks on repairs
-
-
Finance
-
Billing errors (check accounts receivable overdues)
-
Accounts payable deductions missed
-
Vouchers prepared with no defects
-
Clock card or payroll transcription errors
-
Data entering errors
-
Computer downtime
-
Timeliness of financial reports
-
Effectiveness of scheduling program "debugging" time
-
Rerun time
-
Accuracy of predicted budgets
-
Clerical errors on entries
-
Inventory objectives met
-
Payroll errors
-
Discount missed
-
Amounts payable records
-
Billing error
-
-
Forecasting
-
Can departments function with maximum effectiveness with budgets set for them?
-
Can the company buy needed capital equipment, keep inventories supplied, pay its bills?
-
Do projects meet time schedules?
-
Assistance to line organizations (scheduling, planning, and control functions)
-
Methods for finance and cost control
-
Timeliness of financial reports
-
Assets control
-
Minimizing capital expenditures
-
Realistic budgets
-
Clear and concise operating policies; timely submission of realistic cost proposals
-
Completeness of financial reports
-
Effectiveness of disposition of government property
-
Effectiveness of cost negotiations
-
-
Legal
-
Amount of paper used versus finished pages produced
-
Misdelivered mail
-
Misfiled documents
-
Delays in execution of documents
-
Teletype errors
-
Patent claims omitted
-
Response time on request for legal opinion
-
-
Management
-
Output of staff elements, overall defects rates, budgets and schedule controls, and other factors that reflect on managerial effectiveness (In other words, the accomplishments of a manager are the sum totals of those working under him or her)
-
Success in developing estimates of costs versus actual accruals
-
Success in meeting schedules
-
Performance record of employees under the manager's supervision
-
Success in developing realistic estimates on a PERT or PERT/cost chart
-
Success in minimizing use of overtime operations
-
All nonproduction departments can be measured
-
Each department should be measured against itself, using time comparisons, and preferably by itself.
-
The best primary goals are those that measure cost performance, delivery performance, and quality performance of the of the department. Secondary goals can be derived from these primary goals.
-
There should be a base against which quality, cost or delivery performance can be measured as a percentage improvement. Examples of such a base would be direct labor, the sales dollar, the material dollars, or the budget dollar. A dollar base is more meaningful to management than a physical quantity of output.
-
Success in effecting pricing actions so as to preclude subsequent revisions.
-
Pages of data compiled with no defects
-
Clarity and conciseness of operating procedures
-
Evaluations of capital investment
-
Errors in applying standards on process sheets
-
Accuracy of estimates; actual costs versus estimated costs
-
Effectiveness of work measurement programs
-
-
Marketing
-
Success in reduction of defects through suggestion submittal
-
Success in capturing new business versus quotations
-
Responsiveness to customer inquiries
-
Accuracy of marketing forecasts
-
Response from news releases and advertisements
-
Effectiveness of cost and price negotiations
-
Success in response to customer inquiries (customer identification)
-
Customer liaison
-
Effectiveness of market intelligence
-
Attainment of new order targets
-
Operation within budgets
-
Effectiveness of proposals
-
Exercise of selectivity
-
Control of cost of sales
-
Meeting proposal submittal dates
-
Timely preparation of priced spare parts list
-
Aggressiveness
-
Utilization of field marketing services
-
Dissemination of customer information
-
Bookings budget met
-
Accuracy of predictions , planning and selections
-
Accurate and well-managed contracts
-
Exploitation of business potential
-
Effectiveness of proposals
-
Control of printing costs
-
Application of standard proposal material
-
Standardization of proposals
-
Reduction of reproduction expense
-
Contract errors
-
Order description error
-
Sales order errors
-
-
Material
-
Saving made
-
Late deliveries
-
Purchase order (PO) errors
-
Material received against no PO
-
Status of unplaced requisitions
-
Orders open to government agency for approval
-
Delays in processing material received
-
Damage or loss items received
-
Claims for products damaged after shipment from our plant
-
Delays in outbound shipments
-
Complaints or improper packing in our shipments
-
Errors in travel arrangements
-
Accuracy of route and rate information on shipments
-
Success in meeting schedules; material shortages in production
-
Success in estimating inventory requirements
-
Clock card errors by employees
-
Damaged shipments
-
Stock shelf life exceeded
-
Items in surplus
-
Purchase requisition errors
-
Effectiveness of material order follow up
-
Adequacy and effectiveness of planning and scheduling
-
Application of residual inventories to current needs
-
Inventory turnover manufacturing jobs without schedules
-
Timeliness of incorporating ECNs
-
Timely replacement of rejected parts
-
Adequacy of reject control plan
-
Effectiveness of packing operation
-
Application of residual inventories to current needs
-
Floor shortages
-
Labor utilization index
-
Data processing rerun time on material programs
-
Bad requisitions
-
Value of termination stores and residual inventory
-
Manpower fluctuations around mean
-
Percent supplier material ($) rejected and returned; total material ($) purchased
-
Number of defective suppliers (repetitive); total number of suppliers
-
Number of single source suppliers; total number of suppliers
-
Percent of supplier material ($) holding up production: total material $
-
Number of late lots received (actually holding up production); total lots received
-
Percent of purchased material (actual); total material bid or budgeted
-
Percent of reductions in B/M effected through purchasing effort; total material bid or budgeted.
-
Correct quotations or rates
-
Customers call back as promised
-
Installation of exact equipment requested by customer
-
Appointments kept at the time promised customers
-
Prompt handling of complaints
-
Accurate meter readings
-
Courteous treatment of customers
-
Right packages of goods ordered shipped
-
Number of telephone numbers correctly dialed
-
PMI rejects
-
Savings made
-
Material handling budget met
-
Travel expense against open shop orders
-
Orders to government for approval ” disapproved, resubmitted, and open, not approved
-
-
Personnel
-
Success in eliminating security violations
-
Hiring effectiveness
-
Thoroughness and speed of responding to suggestions
-
Employee participation in company sponsored activities
-
Administration of insurance programs
-
Accident prevention record
-
Processing insurance claims
-
Provision of adequate food services
-
Personnel security clearance errors
-
External classified visit authorization errors
-
Speedy processing of visitors through lobbies
-
Records accuracy
-
Adequacy of training programs
-
Thoroughness and speed of investigating suggestions
-
Grievances
-
Employment requisitions filled
-
Administration of insurance program
-
Acceptance of organization development recommendations
-
Effectiveness of administration of merit increases
-
Overhead budget performance
-
-
Product assurance
-
Participation in design reviews
-
Customer liaison
-
Technical society participation
-
Accuracy of proposals and contracts
-
Application of program policies
-
Prevention of field complaints
-
Effectiveness of reporting and recording
-
Customer rejects
-
Rejected material on the floor
-
Adequacy of vendor ratings
-
Effectiveness of field quality control
-
Rejects
-
Screening efficiency
-
Inspection documentation
-
Quality assurance audits
-
-
Product control
-
Success in developing realistic schedules
-
Success in developing realistic estimates
-
Success in identifying defective specifications
-
Process sheets written with no error
-
Transportation hours without damage to product
-
Parts shortages in production
-
Downtime due to shortages
-
-
Production
-
Success in reducing the scrap, rework, and "use-as-is" categories
-
Success in maintaining perfect attendance records
-
Success in identifying defective manufacturing specifications
-
Success in meeting production schedules
-
Success in cost reduction through suggestion submittal
-
Success in improving first article acceptance
-
Performance against standard
-
Success in reducing required MRB action
-
Utilities improperly left running at close of shift
-
Application of higher learning curves
-
Floor parts shortages
-
Delays due to rework, material shortage, etc.
-
Control of overtime (nonscheduled)
-
Prevention of damage to work in process
-
Cleanliness of assigned areas
-
Conformance to estimates
-
Suggestions submitted
-
Labor utilization index
-
Defects
-
Asset utilization
-
Scrap
-
Utilization of correct materials, drawings, and procedures
-
Prevention of damage
-
Safety records
-
Inches of weld with no defects
-
Log book entries with no defects
-
Security violations
-
Compliance to schedules
-
Accuracy of estimates
-
-
Program Management
-
Liaison with customer
-
Financial quality of proposals (technical approach, cost, time)
-
Soundness of project plans
-
Coordination of support activities
-
Satisfactory field sell off
-
Backlog
-
New business volume versus budgeted
-
-
Publications
-
Compliance to specifications
-
Errors corrected
-
Thoroughness of material
-
Quality of production
-
-
Quality control
-
Inspection errors
-
Sampling program errors
-
Timeliness of inspection reports
-
Adequacy of vendor quality ratings
-
Returned goods and field rework due to inspection oversight; customer rejects
-
Quality assurance audits
-
Inspection documentation
-
Customer liaison
-
-
Research and development
-
Can it be applied?
-
Can it be developed?
-
Can it be manufactured?
-
Can it be marketed?
-
-
Security
-
Personnel security clearance errors
-
Timely and accurate processing
-
External classified visit authorization errors
-
Accurate processing of visitor identification
-
Effectiveness of security program
-
Guards, security checks, badges, passes
-
Records accuracy
-
Fire watch
-
-
Services: general
-
Promptness in reply to requests
-
Quality of service rendered
-
Blueprint and drawing control, reproduction, distribution
-
Test equipment maintenance and calibration
-
TRW communication
-
Reproduction facilities
-
-
Purchasing
-
Purchase order changed due to error
-
Late receipt of materials
-
Rejections due to incomplete description
-
-
Supervision
A supervisor's performance is measured by the overall effectiveness of the department; in other words, the supervisor is judged by the sum total of accomplishments of the people working for him or her. The worth of individual or group achievements should be evaluated against the following criteria:
-
Impact of potential error (abort of mission, cost effect on schedules, etc.)
-
Contributions of the individual or group to the prevention of error
-
Difficulty of the job and level of skill required
-
Work schedules and load impact on error potential
-
Ability of individual to correct his/her own errors
-
Attitude of the individual toward work, project, or command mission
-
GUIDELINE COST OF QUALITY ELEMENTS BY DISCIPLINE
| Note | Nonconformance elements listed reflect those that are the responsibility of that department. |
Engineering: price of conformance
| a. | Design specification reviews |
| b. | Product qualification, evaluation, characterization |
| c. | Drawing checking |
| d. | Supplier evaluation |
| e. | Preventive maintenance |
| f. | Process capability studies |
| g. | Fabrication of special test fixtures |
| h. | Verification of workmanship standards |
| i. | Review of test specifications |
| j. | Failure effects/mode analysis |
| k. | Pilot production runs |
| l. | Packaging qualification |
| m. | Customer interface |
| n. | Safety review ” operator safety |
| o. | Technical manuals |
| p. | Preproduction reviews |
| q. | Defect prevention program |
| r. | Schedule reviews |
| s. | Process reviews |
| t. | Early approval of production specifications |
| u. | Computer-aided design (CAD) |
| v. | First piece approval |
| w. | Agency approval |
| x. | Supplier qualification |
| y. | Special test fixture design review |
| z. | Education |
| aa. | Prototype inspection and test |
| ab. | Testing |
| ac. | Receiving sample testing |
| ad. | In-process sample testing |
| ae. | Final sample testing |
| af. | Laboratory analysis and test |
| ag. | Fault insertion test |
| ah. | Engineering audits |
| ai. | Training for special testing |
| aj. | Personnel appraisal |
Engineering: price of nonconformance
-
Warranty expense
-
Engineering travel and time on problems
-
Redesign
-
Premium freight costs
-
Material review activities
-
Failure analysis (return evaluation)
-
Corrective action
-
Failure reports
-
Return goods analysis
-
Product liability (design related)
Comptroller: price of conformance
-
Forecasting performance
-
Training and procedures
-
Ledger review of P & L and balance sheet
-
Budget generation
-
Long-range planning
-
Job description
-
Cost of quality budget
-
Timecard review
-
Capital expenditure reviews
-
Total expenditure reviews and delegation of authority
-
Order entry review
-
Product cost standards
-
Cost reduction
-
Cost of quality reviews
-
Data processing report/financial report reviews
-
Ledger reviews
-
Invoicing review
Comptroller: price of nonconformance
-
Billing errors
-
Inventory out of control
-
Improper A/P vendor payments
-
Incorrect accounting entries
-
Bad debts turnovers, overdue A/R
-
Payroll errors
Software: price of conformance
-
Software planning
-
Software reliability projection/prediction
-
Systems analyst interrogating activities
-
Documentation review
-
Learn/understand customer requirement/business
-
Preparation and review of system specifications
-
Flow chart review
-
Correlation analysis
-
Data entering operator training
-
Tape duplication and verification
-
Program testing
-
Function test
-
Performance test
-
Code verification
-
Depreciation of software ( outdated )
-
System test
-
Inspect programs
Software: price of nonconformance
-
Keeping track of system failures
-
Going back to customer to re-evaluate
-
Customer change requirement
-
Recode; debug; retest
-
Documentation changes
Plant administration: price of conformance
-
Consultants
-
Preventive maintenance program
-
Modeling
-
Controlled/critical storage
-
Environmental control
-
Labor training
-
Review of labor production rates
-
Security
-
Surveillance
-
Machine maintenance ” P.M.
-
Machine maintenance training
-
Timely machine replacement
-
Periodic equipment depreciation review
-
Equipment depreciation reappraisal
-
Facility planning ” audits
-
Facility inspection and test
-
Data on labor productivity
-
Pilot run to check standard
-
Labor surveillance
-
Time card control test
-
Time card audit
-
Machine maintenance test
-
Machine maintenance inspection
-
Equipment depreciation inventory
-
Equipment depreciation audit
-
Equipment depreciation tracking
Plant administration: price of nonconformance
-
Facility planning redesign
-
Facility equipment replacement
-
Missed schedule
-
Incorrect labor level
-
Increased failure
-
Incorrect time
-
Machine scrap
-
Machine rework
-
Machine downtime
-
Product liability
-
Equipment depreciation ” obsolete
-
Equipment depreciation ” premature
Purchasing: price of conformance
-
Supplier review and approval
-
Send proper specs to vendor ” make it clear what is required
-
Periodic seminars
-
Forecasting ” cost of carrying hard-to-get materials
-
Material cost resulting from multiple sourcing
-
Strike build-up costs
-
Evaluation of supplier's equipment that will be used to do the job
-
Review supplier incoming quality practices
-
Recertification of suppliers
-
Incoming inspection cost
-
Information ” systems cost associated with vendor rating
Purchasing: price of nonconformance
-
Scrap
-
Sorting
-
Reinspection due to rejects
-
Rework
-
Excess inventory due to lack of confidence in vendor delivery
-
Loss incurred as a result of vendor delinquencies
-
Corrective action cost
-
Shipping cost on returns to vendors
-
Purchase order changes resulting from error
-
Incoming inspection cost
-
Premium freight
-
Trips to suppliers to resolve problems
-
Expediting cost to ensure proper deliveries (i.e., phone bill)
Marketing: price of conformance
-
Procedures
-
Training
-
Forms design
-
Sales support material
-
Design specs
-
P&L
-
Computive data
-
Market forecast
-
Legal and product safety review
-
User market research
-
Sales support cost
-
Customer survey
-
Sales dollars
-
Service cost by area/advertising
-
Loss leaders
-
Launch U.S. availability
-
Pilot and field test
-
Incentive programs
-
Market survey
Marketing: price of nonconformance
-
Labor of redos ” administration
-
Incorrect order entry
-
A/R receivables
-
Special instruction
-
Field service ” excessive
-
Warranty
-
Literature reprint
-
Contingent liability
-
Unit productivity
-
Product recall
-
Loss of market share
Human resources: price of conformance
-
Pre-screen applications
-
Interviewing
-
Personnel testing
-
Reference checking
-
Security clearance, if necessary
-
Orientation
-
Training
-
Job description and work plans
-
Safety program
-
Quality improvement program
-
Exit interviews
-
Performance appraisal
-
Attendance tracking
-
Productivity rates
-
Personnel records audits
-
Tracking of injuries
Human resources: price of nonconformance
-
Turnover rates
-
Grievance tracking
-
Non-timely filling of position
-
Cost of injuries
Manufacturing: price of conformance
-
Training: supervisor hourly
-
Special review
-
Tool/equipment control
-
Preventive maintenance
-
ZD program
-
Identify incorrect (zero defect) specifications/drawings
-
Housekeeping
-
Controlled overtime
-
Checking labor
-
Trend charting
-
Customer source inspection
-
First piece inspection
-
Stock audits
-
Certification
Manufacturing: price of nonconformance
-
Rework
-
Scrap
-
Repair and return expenses
-
Obsolescence
-
Equipment/facility damage
-
Repair equipment/material
-
Expense of controllable absence
-
Supervision of manufacturing failure element
-
Discipline costs
-
Lost time accidents
-
Product liability
Quality control: price of conformance
-
Quality training
-
Test planning
-
Inspection planning
-
Audit planning
-
Product design review
-
Supplier qualification
-
Productibility/quality analysis review
-
Process capability studies
-
Machine capability studies
-
Calibration of quality equipment
-
Operator certification
-
Incoming inspection
-
In-process inspection
-
Final product inspection
-
Product test
-
Product audit
-
Test equipment
-
Checking gauges, fixtures, etc.
-
Prototype inspection
-
Quality systems audits
-
Customer/agency audits
-
Outside lab evaluations
-
Life testing
-
Product audits
Quality control: price of nonconformance
-
Scrap analysis
-
Rework analysis
-
Warranty cost analysis
-
Concessions analysis
-
Factory returns analysis
-
Material review board action
Industrial engineering: price of conformance
-
Operator training
-
Design review
-
Inventory control
-
Job description
-
Methods description
-
Test equipment description verification
-
Material utilization
-
Line rebalance
-
Process verification
-
Product control card system
-
Material usage verification
Industrial engineering: price of nonconformance
-
Tool repair
-
Tool modification
-
Corrective action costs
-
Engineering change order
-
Purchasing change order
-
Turnover
-
Obsolete job description
Information systems: price of conformance
-
Job descriptions (written)
-
Hiring and testing
-
Schools
-
Program documentation and testing
-
Cost benefit analysis
-
Risk analysis of project
-
Proper communication of user requirements between user and information systems
-
Verification of input data
-
Test techniques
-
Pilots
-
Parallel runs
-
Post implementation audit
Information systems: price of nonconformance
-
Systems do not meet user requirements ” redo
-
Corrective maintenance
-
Reruns
-
Input cycles edit and update
-
Hardware downtime
-
Scheduling failures
Law department: price of conformance
-
Maintenance of law library
-
Seminar on prevention of product liability claims
-
Label copy evaluation
-
Advertisement copy review
-
Safety program audit
-
Equal opportunity program audit
-
Compliance audit of SEC
-
Contract review
-
Checking paperwork for errors
-
Compliance audit on environmental protection agency (EPA)
-
Review of federal/state submissions (new products, patents, etc.)
Law department: price of nonconformance
-
Product liability matters (travel, litigation, outside firms, time)
-
Warranty reviews
-
Penalties for late filing
-
Product complaint review (internal and with regulatory agency)
-
Product recalls
-
Defense of patent infringement suit
-
Representing grievances
-
Internal department rework (rewrite, retype, etc.)
-
Seminar on defending product liability suits
-
Settlements
COST OF QUALITY AND DFSS RELATIONSHIP
We made the statement earlier that perhaps one of the key contributions of COQ in DFSS is to identify and eliminate the "hidden factory" cost. To do that, let us visit some of the more demanding calculations.
First, we begin with a review of the Poisson distribution:
Y = ![]() this of course is equivalent to Y =
this of course is equivalent to Y = 
where n is the total number of independent trials; p is the probability of occurrence; r is the number of occurrences; u is the number of units produced; and d is the number of non-conformities (defects). This value (d) is also known as the np.
Under special conditions, such as normalizing per unit, the d/u = np/u. Therefore, if we substitute terms for the normalizing case where u = 1, for the special case where r = 0 (remember 0! = 1), we are able to reduce the above formulas into
Y = ![]()
The reader will notice that this equation really reflects the first time yield (Y FT ) for a specific d/u. Of course, if we know the first time yield we can solve for d/u with the following formula:
d/u = -ln(Y FT )
where ln is the natural log.
If the assumptions for the Poisson model are not reasonable then we may use the binomial model
Y = ![]() p r q m-r
p r q m-r
This of course, becomes Y = (1 - p) m for the special case of r = 0 where p is the constant probability of an event and q = 1 - p.
In dealing with COQ issues, as Grant and Leavenworth (1980) have pointed out, the Poisson approximation may be applied when the number of opportunities for non-conformance (n) is large and the probability (p) of an event (r) is small. In fact, as n increases and r decreases, the approximation by the Poisson model improves .
Furthermore, we can use COQ issues and information to generate or double-check the validity of the critical to quality characteristic (CTQ) as well as the critical to process characteristic (CTP). Above all, we are capable of measuring the classical perspective of yield. The traditional formula, which is based on process capability, is
Y final = ![]()
where Y final = final yield; S = number of units that pass; and U = number of units tested .
Another way to view yield is to calculate the rolled throughput, which is
Y rt = e -dpu or
Y rt = Y tp;1 * Y tp;2 *,... * Y tp;m or the normalized variation of Y norm = ![]()
where Y norm is the normalized yield; Y rt is the rolled throughput yield; m is the number of categories; tp is the throughput yield of any given category; and dpu is defects per unit.
EAN: 2147483647
Pages: 235
- Chapter I e-Search: A Conceptual Framework of Online Consumer Behavior
- Chapter II Information Search on the Internet: A Causal Model
- Chapter IV How Consumers Think About Interactive Aspects of Web Advertising
- Chapter VI Web Site Quality and Usability in E-Commerce
- Chapter XVII Internet Markets and E-Loyalty