| Now that you understand the business and architectural concepts behind enterprise reporting in general and Reporting Services in particular, let's start creating a report. Setting Up a Report Creating a report involves some common sense steps: you first create a SQL Server Business Intelligence Development Studio (BIDS) project to contain the report-related files, then you instruct BIDS about what data will be shown in the report. After that, you define which data is actually needed in the report and, last but not least, you layout, test, and deploy your report. More Info You can deploy reports through Report Manager. For more information, see the SQL Server Books Online topic "Deploying Reports Through Report Manager."
Creating a Report Project 1. | From the Start Menu, select All Programs | Microsoft SQL Server 2005 | SQL Server Business Intelligence Development Studio. From the File menu, select New | Project.
| 2. | The New Project dialog box appears. In the Project Types pane, select Business Intelligence Projects. In the Templates pane, select Report Server Project. Choose a name for the project and the destination directory. I have chosen BasicReport and SQL2005StepByStep_Reports, respectively. Your dialog box should look like this:
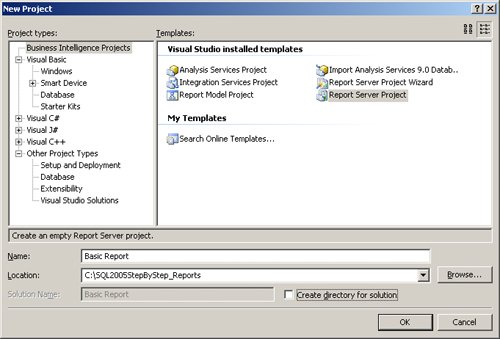 Caution  | In this procedure, we will not use the other type of report project: the Report Server Project Wizard. Be sure not to choose this type of project. In case you do, the Report Wizard will appear when you click the OK button. If this happens, cancel the process and start again. The Report Wizard compresses the report creation process and partially hides it from you. This is fine for simple reports, but for this example, we will show you the usual way that experienced professionals proceed. That's why the non-wizard option is presented here. |
| 3. | Click the OK button to create the project.
| 4. | Because the report project is quite simple, the Solution Explorer pane will show almost nothing. Don't worry, this is the expected result. You can see the Solution Explorer by selecting Solution Explorer from the View menu.
| 5. | Now, you will add your first empty report by right-clicking on the Reports folder within Solution Explorer and selecting Add | New Item from the context menus.
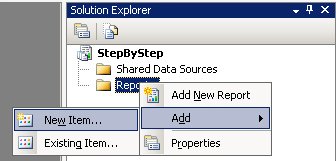 Note  | You can also start by creating a report using the Add New Report context menu option; however, this choice will fire the Report Wizard instead of adding a blank report to the project. |
| 6. | The Add New Item dialog box appears, as shown below. Here you will need to select Report in the Templates pane and enter BasicReport v1 as the name for your report.
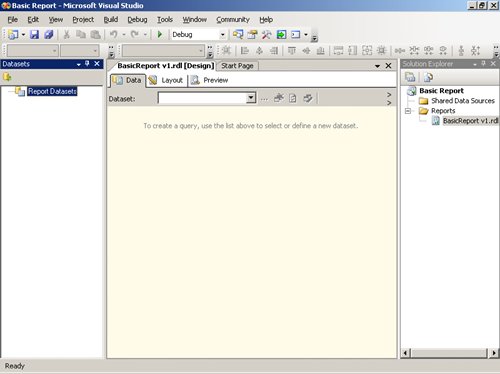
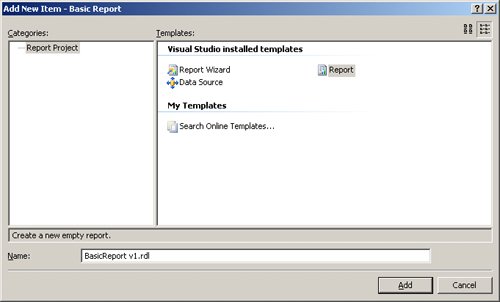 | 7. | Click the Add button to confirm the process. BIDS displays a blank, freshly created report in the Report Designer, shown below:
 |
Creating a Shared Data Source 1. | In order to design a report, we need to tell BIDS which data source to use. Right-click on the Shared Data Sources folder in Solution Explorer and choose Add New Data Source from the context menu. The Shared Data Source dialog box will appear.
Note | You can create a report without using a shared data source by defining a data source tied to the report datasets. In this case, the data source is not shared but is private to the report. Although this option is valid in some cases, you should use shared data sources whenever you can to make reporting solution management easier in both the short run and the long run. |
| 2. | Enter dsAdventureWorks as the name for the data source.
Note | If you need to access a data source other than Microsoft SQL Server, you can choose supported data sources from the Type dropdown list. |
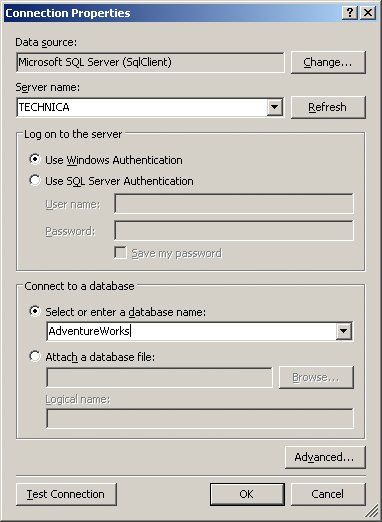
| 3. | You could type the connection string, but clicking the Edit button will bring you to the familiar Connection Properties dialog box, shown below. Fill in the boxes in the manner appropriate to your system. For this example, set up a connection string to the AdventureWorks sample database.
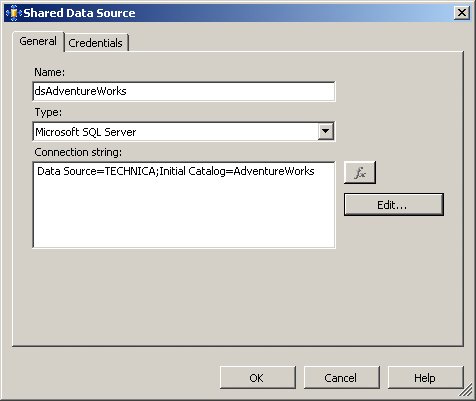
 | 4. | By clicking the respective buttons, set advanced options if you feel they are necessary to your system. Test the connection, too. After clicking the OK button, you can check the connection string generated in the Shared Data Source dialog box, shown here:
 | 5. | You will notice that authentication information is not shown on the connection string. Click on the Credentials tab to look at the available options.
| 6. | Click the OK button to create the data source. The data source appears in the Shared Data Sources folder. Note the file extension is .rds.
|
Defining a Dataset 1. | Now you must let BIDS know what data you want to display on the report. To do this you need to create at least one dataset, sometimes more than one. Check that the Data tab is visible in the central area of BIDS. Open the Dataset dropdown list and choose <New Dataset...>.
| 2. | The Dataset dialog box appears, as shown below.
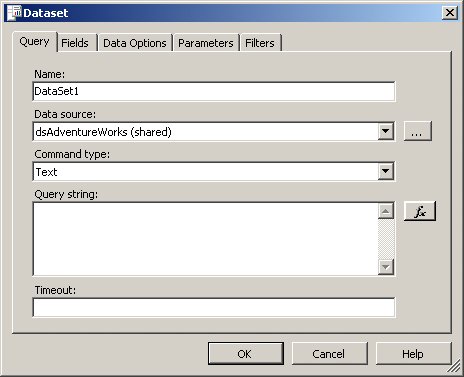 | 3. | Enter dsEmployeeSales as the name for the dataset (this dataset will end up gathering and containing employee sales data).
| 4. | Double-check that the shared data source is selected in the Data Source dropdown list and that Text is the command type. Notice the alternative of using a stored procedure instead of text.
| 5. | You can use a more advanced query designer to assist in creating your dataset expression. For now, type this simple query into the Query String field:
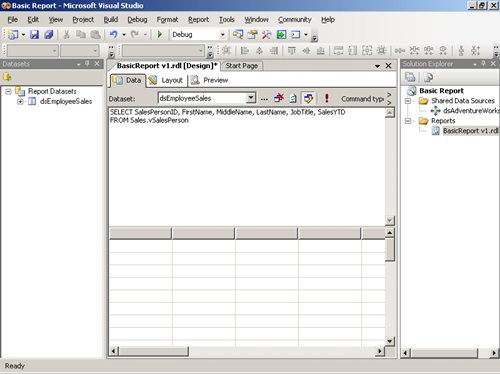
SELECT SalesPersonID, FirstName, MiddleName, LastName, JobTitle, SalesYTD FROM Sales.vSalesPerson
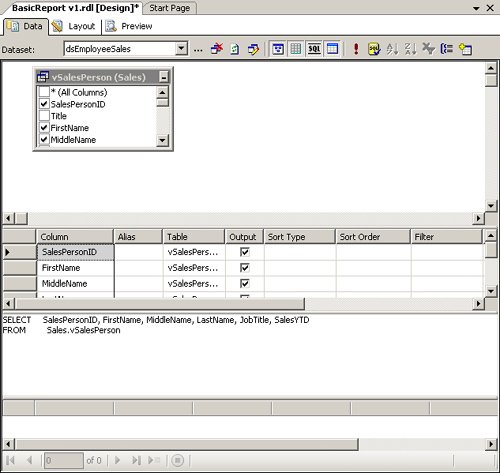
| 6. | Click the OK button to accept the query. The dataset query appears on the Data tab, as shown below.
 | 7. | You can test and check the query results by clicking the Execute button (the button with the red exclamation point).
| 8. | Do not be confused by the barebones screen you are looking at. This is the Generic Query Designer. You can switch this on and off by clicking the Generic Query Designer toolbar button, shown here:
 By toggling this button, you can work with a full-blown query designer, shown on the following page, or with the initial simpler one.
 Note | You may wonder why it takes so many steps to reach the typical query designer. The main reason is that Reporting Services could use many different query types, such as stored procedures or VB.NET expressions, and many of them are not well suited for the typical relational table-oriented designer. Therefore, the classical query designer is not the default option. |
| 9. | Note the asterisk symbol that appears next to the report name on the BasicReport v1.rdl[Design] tab. This asterisk means that the file has unsaved changes. Save your report by clicking the Save toolbar button. The asterisk will disappear once your work has been saved.
|
Laying Out, Testing, and Refining a Report Now that you have a project and some data defined, it's time to lay out, test, and refine your report. Laying Out a Report 1. | With your report still open, switch to the Layout tab. You will see a short rectangle dotted with gridmarks.
| 2. | Hide the Solution Explorer pane by unpinning it so you will have more room to work with in the report design area.
Caution | Notice the ruler on the top and the size of the initial design area. You might wonder why this area is not the size of your preferred paper size (Letter, A4, etc.). Reporting Services is not tailored to producing paper reports, therefore the layout tools don't automatically relate to paper sizes. |
| 3. | From the View menu, select Toolbox.
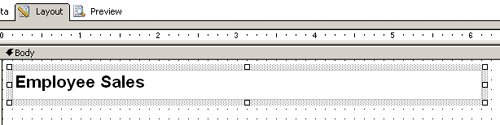
| 4. | Drag and drop a Textbox control from the Toolbox onto the grid surface. Type Employee Sales inside, resize the textbox to contain a bigger text, and adjust format (font size 16 points and bold) to look like the image below. The font can be adjusted by right-clicking the text, selecting Properties, and then selecting the Font tab.
 Caution | If you widen the textbox too far to the right, you will notice that the design area widens to accommodate your control size. Be careful, because Reporting Services does not constrain you from overflowing the expected page size. Thus you may end up with a report spanning more than one page in width. To correct this, you can narrow your control, deselect it, and then drag the right grid border back to its original size. |
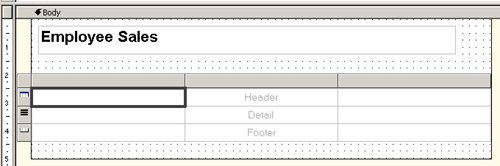
| 5. | Now create a place for hosting the report data. Drag a Table control from the Toolbox and drop it onto the design surface, as shown below. Do not worry about the specific place where you drop it, because it will expand end to end width-wise. The table will show three rows and nine cells. Note the grey top and left table borders. They will disappear when deselecting the control, and will reappear when you reselect it. The grey areas will help you to perform specific operations like selecting a full column, a full row, or the entire table.
Tip  | Selecting an entire table can be tricky. If you click on the control, only a cell is selected; if you click outside the control, you deselect it, as expected. How do you select the full table? You can use the orthodox method of selecting a cell to make grey borders appear and then clicking on the border in the top-left corner box, or, if no control is in the middle, by clicking outside the table on the design surface and dragging a selection box that only touches the table control. |
 | 6. | Show the Datasets pane by selecting Datasets from the View menu. Then expand the dsEmployeeSales node tree.
| 7. | Drag the SalesPersonID field and drop it into the left-most table cell of the middle row (in the Detail row). Note that an expression is shown in that cell. We will come back to that in a later step.
| 8. | Repeat the drag-and-drop operation with LastName and JobTitle fields, filling the center and right Detail area cells, respectively. Do not worry about the FirstName and MiddleName columns; you will use them later when building an expression to return the full employee name.
| 9. | You will need an additional column and more space to host the SalesYTD field. To do so, narrow the SalesPersonID column by clicking and dragging the line between the SalesPersonID and the LastName column headers. Notice the double-headed arrow icon appears when the cursor is over the mentioned line. Observe, too, that the table narrows accordingly.
| 10. | Right-click on the JobTitle column header and choose Insert Column To The Right from the context menu to add a column to the right of the JobTitle column. Drag and drop the SalesYTD field to the newly created Detail cell.
| 11. | Now, the design area will have expanded to the right. If you want to print the report on paper, you will need to keep the area width under control. Resize the SalesYTD column to be narrower and drag the design area border to the correct width. Which is the correct width? Check the sidebar titled "Finding the Right Design Area Width."
| 12. | Save your work by clicking the Save button.
|
Finding the Right Design Area Width Undesired empty pages are one of the confusing side effects that report designers find when printing reports or exporting to paper-like formats. What is the reason for these empty pages? Often there is a simple mathematical explanation. Reporting Services uses three elements to determine where to place page breaks: page width, page left and right margins, and surface design width. Note that I have said surface design width and not surface design used width. The top ruler is your guide for seeing the width of the surface design. You see report page layout information by selecting Report Properties from the Report menu. In the Report Properties dialog box, select the Layout tab. Here you have the page and margin dimensions. With these values at hand, you can calculate the maximum design area width that will print the report within the width of one page. Maximum Area Width = Page Width - Left margin - Right margin In case you like to use the classical landscape orientation for reports instead of the document-oriented portrait one, simply switch the Page Width and Page Height values on the Layout tab. Of course, your design surface area width should use this new page width value. |
Previewing a Report 1. | Having our basic layout in place, let's preview what the report will look like. Click on the Preview tab in the design view. A message that the report is being generated will appear briefly before the report processing results are displayed.
Caution | Do not click on the Start Debugging green arrow toolbar button or press the F5 key. Either of these actions will trigger the Build and Deploy operation. Right now, we are just interested in seeing a preview of our report. |
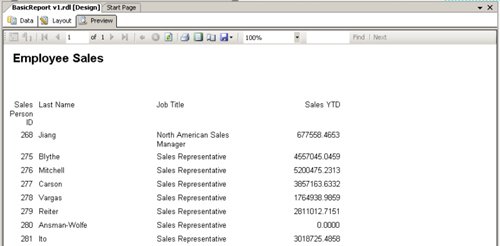 You will notice some editing is needed, like number formatting or adjusting the Sales Person ID column title. We will do that in the following sections. From the Preview tab, you can print, print preview, and export the report results. You will notice some editing is needed, like number formatting or adjusting the Sales Person ID column title. We will do that in the following sections. From the Preview tab, you can print, print preview, and export the report results.
| 2. | To preview the report in the printing form, you can click on the Print Layout toolbar button. The Print Layout button is a toggle button; therefore, it will stay "on," although you switch tabs, until you switch it to "off" again.
Warning  | The Reporting Services preview tab is rendered by the Preview renderer, which is different from other renderers, like the HTML renderer or the PDF renderer. The difference shows dramatically when looking at paging behavior. If you need to deliver the report in any specific format, check the page breaks directly in that format; do not pay any attention to the page breaks you see on the Preview tab. Do not be fooled by those page breaks, as the Preview renderer does not use your page breaking settings. |
| 3. | Return to the Layout tab to continue editing the report.
|
Editing Text in Table Cells 1. | You want to show each employee's full name instead of their last name only. You will do that in a following step by editing the expression. In the meantime, you will edit the column title. Double-click on the cell that includes the "Last Name" text to enter into edit mode. Delete the word "Last" to leave the word "Name" only.
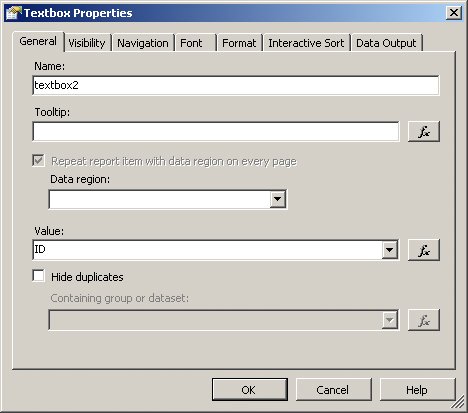
| 2. | Trying to repeat the operation with the "Sales Person ID" cell might be confusing because the reduced space allotted to it leaves most of the text hidden. However, you can edit the text exactly the same way. Edit the text to leave only "ID" as the column title. Alternatively you might change the value through a number of different methods:
- By right-clicking on the cell and selecting Properties to display the Properties dialog box shown below. There you can edit the Value dropdown list.
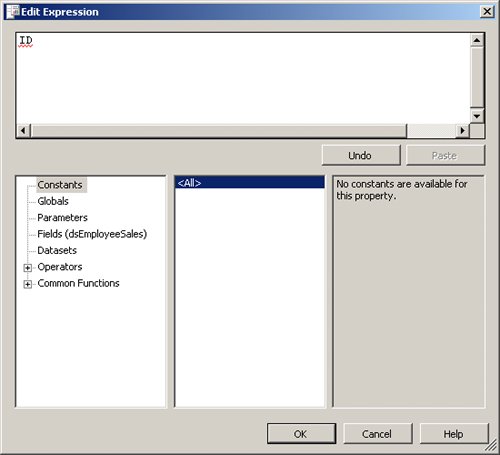
 - By right-clicking on the cell and choosing Expression to bring up the Edit Expression dialog box, as shown below. There you can edit the expression.
 - By pressing the F4 key or clicking the Properties Window toolbar button to show the Properties window (or by clicking on the Properties window itself if it is already visible). In the Properties window, you can edit the Value dropdown list.
| 3. | Save the report
Caution | Report item properties can be edited through both the Properties dialog box and the Properties window. Some properties are easier to edit in one place than the other. Usually the Properties dialog box is the best choice because it offers more assistance in setting properties the right way. Some elements, like Groups, the Body, or the Report itself, have properties that show on the Properties window only; they have no Properties dialog box. |
|
Formatting Items 1. | Click on the cell that contains the Sales YTD field value (the right-most cell of the middle row).
| 2. | Edit the format of the expression to make it more readable. In this case, choosing the Properties dialog box rather than the Properties window makes an important difference because the dialog box provides far more options to assist you, so right-click the cell and select Properties.
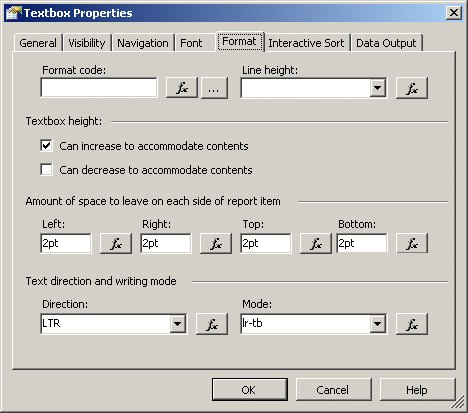
| 3. | Navigate to the Format tab, shown below. Note the Format Code textbox and the adjacent buttons.
 | 4. | Click on the ellipsis (...) button to bring up the Choose Format dialog box. If you click on the Function button, the Edit Expression dialog box appears. This is the same result you will obtain if you edit the Format property on the Properties window. You can set the format from the Properties window as well, but you would need to know exactly what to write for them.
| 5. | Choose Currency, and click the OK button. Note that the value in the Format Code textbox is "C." Format codes used by Reporting Services are the .NET Framework formatting types.
More Info You can find more details about the .NET Framework formatting types in the .NET documentation or online at http://msdn2.microsoft.com/en-us/library/fbxft59x.aspx. | 6. | Click the OK button to accept the edit to the textbox properties and preview the report to check the changes you have made so far.
| 7. | Save the report.
Caution | Note that if you try to save the report while on the Preview tab, the Report Designer asks you to save the report results, not the report layout. To save the report layout, you must leave the Preview tab and show the Layout tab or the Data tab. |
|
Editing an Expression 1. | Select the Last Name field value (the second-to-left cell of the middle row). You will change the expression in it to show the employee's full name instead of just the last name.
| 2. | Right-click the cell and select Expression. The Edit Expression dialog box will open. Expressions in Reporting Services should be written in Visual Basic .NET syntax. Alternatively, you can edit the expression directly in the cell, without bringing up any dialog box at all. The latter way is perfectly suitable for minor edits, like adding a single space or something similar; however, when a more advanced edit is necessary, the Edit Expression dialog box is more practical.
| 3. | The current expression value is:
=Fields!LastName.Value
You should note several elements of this expression:
- Equal sign (=) The equal sign indicates that the text following this sign is an expression and not plain text (or a string in programming terms).
- Fields! The Fields! part of the expression indicates that LastName is an element in the Fields collection. Check the sidebar titled "The Reporting Services Collections" for more information about collections in RDL.
- The Value property Every RDL object has a set of properties you can access when editing expressions. When editing the expression in the Edit Expression dialog box, Intellisense gives you a list of properties for each item type.
| 4. | Because you want to show some additional fields, edit the expression to look like this:
=Fields!FirstName.Value & " " & Fields!MiddleName.Value & ". " & Fields!LastName.Value
| 5. | Save the expression by clicking the OK button, and preview the report to check the expression's results. You will notice that your edited expression works in most cases, but not in all of them. Look at the employees with IDs 277 and 279, for example. The former has no middle name; thus, the abbreviation dot and the separation space should be omitted. The latter has a fully spelled middle name; thus, the abbreviation dot should be omitted, but the separation space should remain.
| 6. | You will need to edit the expression, making it a bit more complex for the sake of accuracy. Edit the expression to match the following one, and click the OK button.
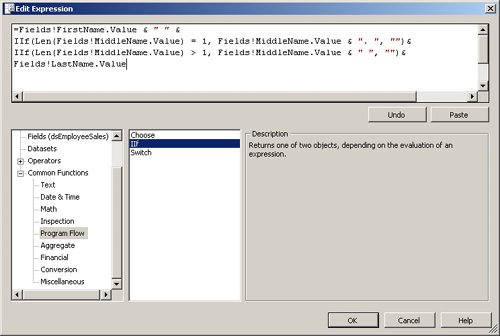
=Fields!FirstName.Value & " " & IIf(Len(Fields!MiddleName.Value) = 1, Fields!MiddleName.Value & ". ", "")& IIf(Len(Fields!MiddleName.Value) > 1, Fields!MiddleName.Value & " ", "")& Fields!LastName.Value
| 7. | To enter this expression, you can follow (and mix) two paths: writing directly in the expression text-editing box or picking elements from the assisting lists at the bottom side of the dialog box. In the following figure, notice the IIf function. Play a bit with the options in order to get used to the function's behavior. Notice that Intellisense and syntax coloring help you build a valid expression.
 | 8. | Preview your report and note that the issues with the middle name have now been resolved.
| 9. | Save the report.
|
Adding a Total 1. | You want to add a grand total showing the total sales (SalesYTD) made by the salespeople as a whole. First show the Datasets pane to view the fields. Expand the dsEmployeeSales node.
| 2. | Drag the SalesYTD node and drop it in the right-most cell in the bottom row of the table, just under the SalesYTD details cell.
| 3. | Note that the resulting expression is:
=Sum(Fields!SalesYTD.Value)
Report Designer has understood that you want to add a summary because the drop operation is to the Table Footer row, not the Detail row.
| 4. | Because this item is brand new, the Format property is empty. This means that the summary will show a different numeric format than the column above it. To correct this, open the Properties window and simply type a C as the value for the format property.
| 5. | Save the report.
|
Adding Visual Appeal Add some visual formatting features to make the report easier to read and to practice some formatting in the Report Designer. 1. | Select all the column titles by clicking on the ID cell and dragging across the top row.
| 2. | Bring up the Properties window, and locate the Font property group.
| 3. | Notice the plus sign (+) on the grey border on the left. It denotes you are dealing with a property group. Click on it to expand the actual Font properties.
| 4. | Choose Bold for the FontWeight property. You can do that by typing Bold in the box or by selecting Bold from the dropdown list.
Note the text on the Font property group summary entry: "Normal; Arial; 10pt; Bold." You can edit property values without expanding the nodes by simply entering values in the right positions in this string.
| 5. | Locate the BorderStyle property group and expand it.
| 6. | Set the Bottom property to Solid.
| 7. | In the design surface, select the whole Details row by clicking on the grey Details row header button located on the lefthand side of the table.
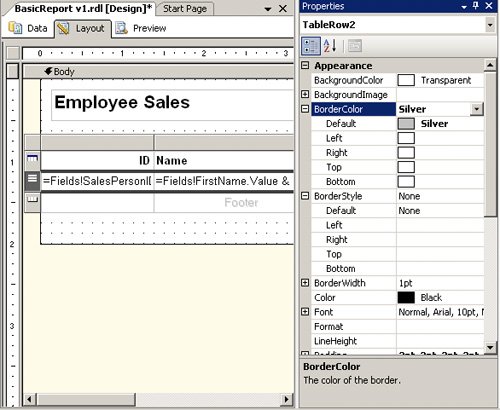
| 8. | In the Properties window, set the BorderColor property group to silver by typing Silver in the value box. Expand the BorderColor node to see that silver is actually the default color, as shown below.
 | 9. | Select the whole Table Footer row and set the BorderStyle.Top property to Solid.
| 10. | Select the Grand Total cell and set the FontWeight to Bold.
| 11. | Preview the report to check the changes.
| 12. | Switch to the Layout tab and save the report.
|
Conditionally Setting a Property Value RDL relies heavily on expressions to offer a powerful set of features. Almost anywhere you can set a property, you can set the property value through an expression instead of using an explicit value. You can use this feature to highlight sales representatives who are not reaching their target. 1. | Select the SalesYTD cell in the Details row.
| 2. | Find the Color property in the Properties window.
| 3. | View the available property values by clicking on the dropdown list arrow. Notice the <Expression...> entry at the top of the dropdown list. Click on it to bring up the Edit Expression dialog box, shown below.
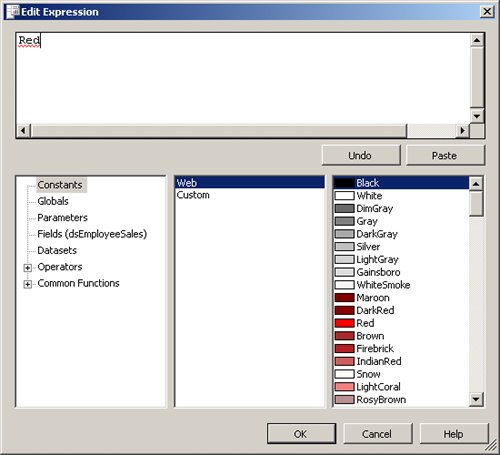 | 4. | Notice the color options, available as constants. Change the expression to match the following one.
=IIf(Fields!SalesYTD.Value<3500000, "Red", "OliveDrab")
Do not forget to put the equal sign at the beginning or else your entry will be considered a string not an expression.
| 5. | Accept the expression by clicking the OK button. Check the results on the Preview tab.
| 6. | Combine a couple of IIF functions to provide additional flexibility, for example:
=IIf(Fields!SalesYTD.Value<3500000, "Red", IIf(Fields!SalesYTD.Value>5000000, "OliveDrab", "Black"))
| 7. | Preview your results, then switch to the Layout tab and save the report.
|
Sorting Results The report you have built so far displays records in no particular order. Because sales info is relevant in this report, sorting data accordingly is a natural option. 1. | Click anywhere in the table to display the table's grey borders.
| 2. | Right-click the upper-left corner of the table's border and select Properties.
| 3. | In the Table Properties dialog box, navigate to the Sorting tab.
| 4. | In the Sort On grid, select the Fields!SalesYTD field from the dropdown list in the Expression column. Note the equal sign (=) added in front of the expression.
Caution | Be aware that there are many places in dialog boxes where an expression is expected instead of an object or property name. If you specify an object or property name in these cases, you will not obtain the expected results. |
| 5. | Select Descending from the dropdown list in the Direction column.
| 6. | Accept the changes by clicking the OK button. Save the report and check the results on the Preview tab. When finished, switch to the Layout tab again.
|
Letting Users Sort Results Although having a default sort order is a good idea, letting the users change the sort expression and direction is even better. 1. | Right-click the SalesYTD text cell in the Header row and select Properties from the context menu.
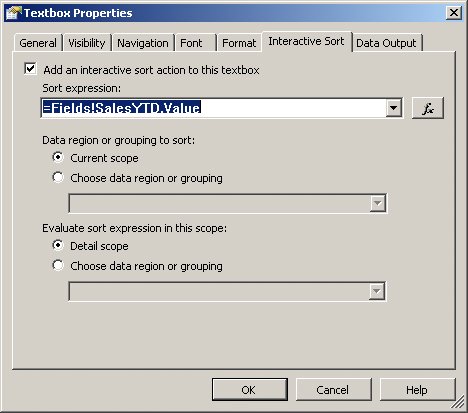
| 2. | Navigate to the Interactive Sort tab.
| 3. | Select the Add An Interactive Sort Action To This Textbox checkbox. Choose the rest of the values according to the figure on the following page.
 | 4. | Accept the changes by clicking the OK button. Save the report and check the results on the Preview tab.
| 5. | Notice the double-headed arrow next to the SalesYTD label. When you click it, the table contents sort accordingly.
| 6. | Repeat steps 1 through 5 on the rest of the column headers in order to allow interactive sorting on any of these columns. Notice that when you apply the procedure to the Name expression column, the expression itself is not available. If you want to sort by the expression, you will need to copy the expression, actually duplicating it. To handle this issue you will learn, in a later section, how to add code that can be shared inside the report.
| 7. | Save the report and check the results on the Preview tab, then switch to the Layout tab when finished.
|
Filtering Data Most reports require the user to provide some kind of filter to be applied to the data. Therefore, you need to give the user a way to indicate what data filters should be applied. The tool to accomplish this is a report parameter. In this section, you will create a parameter to filter employees according to their territories. 1. | Go to the Data tab.
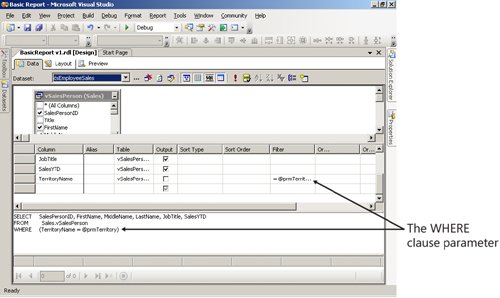
| 2. | Edit the query to add a WHERE clause that uses a parameter as shown below. You can name the parameter prmTerritory.
 | 3. | From the Report menu, select Report Parameters.
| 4. | You will see that Report Designer has added a parameter by parsing the dataset query.
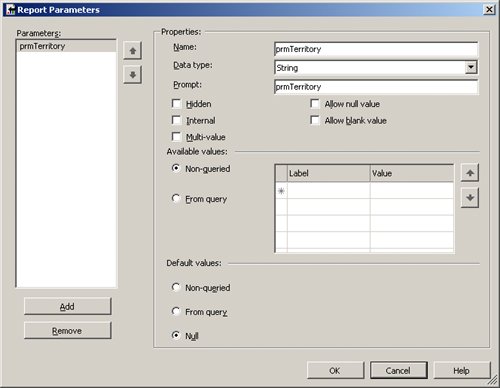 | 5. | You will edit the parameter to make it more user friendly later, but for the moment, let's use it as it is. Click the OK button to close the Report Parameters dialog box, and preview the report.
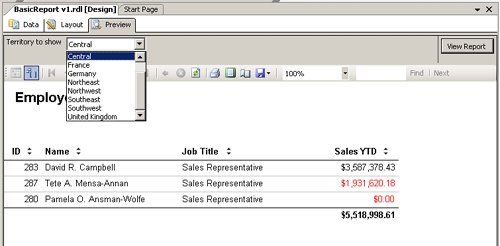
| 6. | Type Central in the textbox labeled prmTerritory and click the View Report button. The report will process and show the following results.
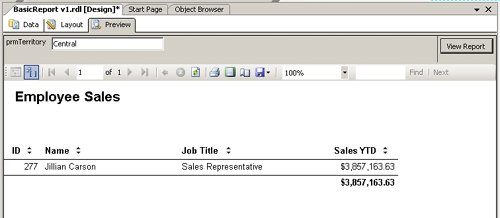 Of course, asking the user to memorize and type flawlessly all territory names is not the best solution. You should offer some assistance to the users by letting them choose from a list of available territories. To achieve this objective, you need to create a new dataset and fill the parameter values with its output. Of course, asking the user to memorize and type flawlessly all territory names is not the best solution. You should offer some assistance to the users by letting them choose from a list of available territories. To achieve this objective, you need to create a new dataset and fill the parameter values with its output.
| 7. | Go to the Data tab and save the report.
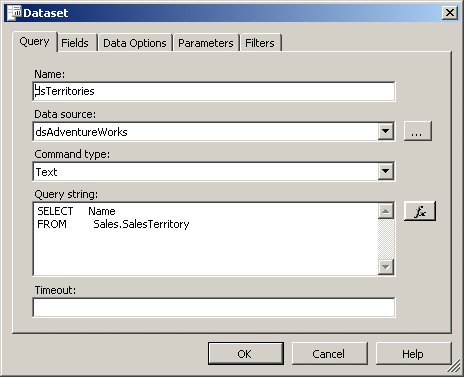
| 8. | Open the Dataset dropdown list and select <New Dataset...>.
| 9. | Edit the Name and Query String fields to match the ones shown below, clicking the OK button when you are done:
 | 10. | To use this query (or dataset) as the source for the parameter values, you will need to edit the parameter properties. From the Report menu, select Report Parameters.
| 11. | Edit the parameter properties to match the following ones (note that the Prompt and Default Values have been edited too):
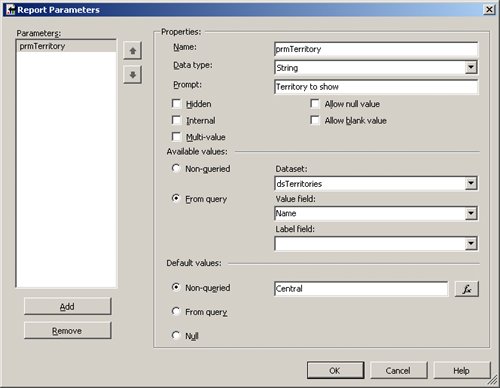 | 12. | Accept the changes by clicking the OK button.
| 13. | Save the report and preview it. Notice that the report is processed without waiting for the user to choose a value from the dropdown list. This is due to having a default value declared in the parameter properties. Leave the parameter default value blank to change this behavior.
| 14. | Select a different territory from the Territory To Show dropdown list and click the View Report button to reprocess the report with the new filter value.
 |
Adding Code to a Report If you want to set several properties using the same expression, like the sales target expression you used in the previous section, you might choose to copy and paste the code in each expression. However, this approach is inefficient and hard to maintain. For example, you will have to update each occurrence if you ever need to edit the report to change the sales target. To resolve this issue, you should put the code in a centralized place, be it the report itself or an external assembly referenced by the report. In this chapter, we will show you the first case only. More Info To learn more about using external assemblies in reports, see the SQL Server Books Online topic "Using Custom Assemblies with Reports."
You will develop a report function to centralize the employee's full name calculation. Therefore, you will leverage the expression you entered previously in the cell under the Name column title. Adding Code Using the Code Tab 1. | Switch to the Layout tab. From the Report menu, select Report Properties.
| 2. | Navigate to the Code tab. You will see an empty textbox where you can enter the code. This textbox offers no assistance at all in typing (no colored syntax, no Intellisense). Therefore, use it only in special cases or when you are confident in the accuracy of your entry. It's a good idea to type the code into a more powerful editor, test it, and then just paste the resulting code in this textbox.
| 3. | Paste or type the following code into the Custom Code window (this code is wordy, but the variable names are short for the sake of code readability):
function FullName (fn as String, mn as String, ln as String) as String Dim res as string res = fn & " " res &= IIf(Len(mn) = 1, mn & ". ", "") res &= IIf(Len(mn) > 1, mn & " ", "") res &= ln return res end function
| 4. | Click the OK button to accept your changes.
| 5. | On the Layout tab, right-click the Details row of the Name column and select Expression from the dropdown menu. Edit the content to match the following one:
=Code.FullName(Fields!FirstName.Value, Fields!MiddleName.Value, Fields!LastName.Value)
| 6. | Save the report and check the results on the Preview tab. If you made a mistake when typing the code or the expression in the cell, you will receive an error on the Preview tab.
| 7. | Now, you can leverage this code in other places, like the interactive sorting option for the Name column. Although it would make more sense to sort by last name, change the sorting field just for learning purposes as follows. Select the Name column title cell on the Layout tab.
| 8. | Right-click the cell, select Properties, and navigate to the Interactive Sort tab.
| 9. | Replace the current expression with the following one, clicking the OK button when you are finished:
=Code.FullName(Fields!FirstName.Value, Fields!MiddleName.Value, Fields!LastName.Value)
| 10. | Save the report and check the results on the Preview tab. Notice that the Name column is sorted by the full name instead of the last name, as expected.
|
The Name Property and the Dataset Property Some interesting properties are set automatically by Report Designer as we design the report layout. You need to know these properties and their meaning in order to fully understand report editing. All items in the report are identified by name. The Name property is set as usual, adding an ordinal after the item type, for example textbox1, textbox2... or table1, table2... Although these names are perfectly legal and usable, they are not well suited to clean programming. In the programming world, the recommendation is to give each item a user-friendly name that facilitates identifying items when coding, with no exception. In Report Designer, however, many objects exist without you noticing them until you need them for some reason. Therefore, although we hesitate recommending that you edit each item name, this is not a bad procedure at all. In any case, you should at least edit the names of items used in expressions. To see all named items that exist in your report, you can open the object dropdown list at the top of the Properties window. Alternatively, you can look directly at the RDL XML and search for the Name attribute in the elements. The Dataset binding property is also important. Some report items, such as those that are containers or data regions, know "magically" from where they should extract data. If you check the Dataset property value on a Table report item that contains some fields, you will notice that this property is set to a dataset name. In our example, it is set to dsEmployeeSales. This binding sets the data source for all data-dependent elements inside this container item. If you check the property in a freshly created table, you will find it to be empty until you drop a field inside or you bind it manually.
|
The Reporting Services Collections In addition to the Fields collection you have used in our sample report, Reporting Services provides other collections for use in report expressions: Globals, Parameters, ReportItems, and User. Each of these collections groups a different kind of item: Fields Refers to the fields contained in a specific dataset. Using the Fields collection inside a data region, such as a table, assumes the dataset it belongs to through the data region binding (data region binding is specified through the data region's Dataset property). When used outside of a data region, the Fields collection requires you to specify the scope (by explicitly naming the dataset). Globals Contains items like PageNumber, TotalPages, ReportFolder, and ReportName. You will need to use the elements of this collection quite often. Parameters Contains any parameters declared in the report. If the report declares any parameters, their properties can be accessed through this collection. ReportItems Includes all the textboxes in the report. Keep in mind that table cells are textboxes too. Therefore, you can access an interesting set of objects through this collection. User Includes only two objects: User and Language; however, you can access these objects only through the User collection.
More Info For more information, see the SQL Server Books Online topic "Using Global Collections in Expressions (Reporting Services)."
|
|