How to Use WinDbg to View the KMDF Log
KMDF includes an internal trace logger that generates a log for each KMDF driver. The log contains a recent history of events, such as those generated by the progress of IRPs through the framework and the corresponding requests through the driver. You can use WDF debugger extensions to view and save the KMDF log during interactive debugging. You can also make the KMDF log as part of a small memory dump, so that you can inspect the contents of the log after a crash.
To View the KMDF Log During a Debugging Session:
-
If you have not already done so, load the KMDF debugger extensions, as discussed earlier in this chapter.
-
Set the search path for the KMDF TMF file.
The file is named WdfVersionNumber.tmf and is located in the %wdk%\WDKVersionNumber\tools\tracing\Architecture. To set the search path, run the !wdftmffile debugger extension command followed by the path to the folder that contains the TMF files. The following example sets the search path for the TMF file for WDF version 1.5 from the build 6000 of the WDK, for a computer running a 32-bit version of Windows:
-
!wdftmffile %wdk%\6000\tools\tracing\i386\wdf01005.tmf
You can also set the search path by setting the TRACE_FORMAT_SEARCH_PATH environment variable. The !wdftmffile command takes precedence over the search path that is set by the environment variable.
-
-
Display the contents of the log file in the Command window by running the !wdflogdump debugger extension command followed by the name of your driver. Do not include the .sys extension.
For example, to dump the KMDF log for Osrusbfx2, run the following command:
-
!wdflogdump osrusbfx2
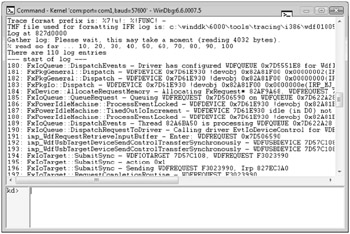
Figure 22-9 shows a sample KMDF log output for Osrusbfx2.
-

Figure 22-9: KMDF log for Osrusbfx2
You can also save the contents of the KMDF log as a trace log file by running the !wdflogsave command as follows:
-
!wdflogsave [DriverName [FileName]]
Replace DriverName with the name of the driver and FileName with a name for the saved log file. If you omit FileName, the default name for the file is DriverName.etl.
Getting Log Information after a Bug Check
After the system bug checks, you can sometimes use the !wdfcrashdump command to display KMDF log information. The log information is available only if KMDF determines that your driver caused the bug check or if you have set the driver's ForceLogsInMiniDump registry value. If a debugger is attached when the bug check occurs, you can use the !wdfcrashdump debugger extension to view the KMDF log information immediately. Otherwise, view the information by loading the memory dump file.
KMDF can determine whether a particular driver caused the bug check codes in the following list:
| Code | Value |
|---|---|
| DRIVER_IRQL_NOT_LESS_OR_EQUAL | 0xD1 |
| IRQL_NOT_LESS_OR_EQUAL | 0xA |
| KERNEL_APC_PENDING_DURING_EXIT | 0x20 |
| KERNEL_MODE_EXCEPTION_NOT_HANDLED | 0x8E |
| KMODE_EXCEPTION_NOT_HANDLED | 0x1E |
| PAGE_FAULT_IN_NONPAGED_AREA | 0x50 |
| SYSTEM_THREAD_EXCEPTION_NOT_HANDLED | 0x7E |
Controlling the Contents of the KMDF Log
You can control several aspects of the KMDF log:
-
Size of the log.
-
Amount of information that is written to the log.
-
Prefix string that is prepended to messages that are written to the log.
Log Size
As discussed in "How to Prepare the Test Computer for KMDF Debugging" earlier in this chapter, you can specify the number of memory pages that the framework assigns to the log by setting the LogPages value of the driver's Parameters\Wdf registry subkey. You can specify values ranging from 1 to 10 pages. Remember that the size of a crash dump file is limited. If the log is large, the operating system might not write the contents of the log to such a file.
Amount of Information
You can change the amount of information written to the KMDF log file by setting the VerboseOn value in the driver's Parameters\Wdf registry subkey. A nonzero value for VerboseOn causes the framework to record detailed, developer-level information in the log. You should set VerboseOn only while developing and debugging your driver because doing so can degrade performance.
Message Prefix
Each line in the KMDF log is preceded by a string that is called the trace message prefix. The trace logger prepends this prefix to each message that is written to the log. By default, the prefix includes a standard set of data elements, but you can change the default elements to suit your particular requirements.
You can change the prefix string for a KMDF driver by setting the TRACE_FORMAT_PREFIX environment variable or by using the !wdfsettraceprefix debugger extension command. Setting TRACE_FORMAT_PREFIX allows you to control the format of the standard information captured by ETW, such as line, function name, module name, and so on. The contents of the prefix are specified by a format string that is similar to the one in printf statements.
See "Trace Message Prefix" in the WDK for details on how to construct a format string-online at http://go.microsoft.com/fwlink/?LinkId=80623.
To set the environment variable, use a command like the following:
-
Set TRACE_FORMAT_PREFIX=%2!s!: %!FUNC!: %8!04x!.%3!04x!: %4!s!:
This command sets the trace message prefix to the following:
SourceFile_LineNumber: FunctionName: ProcessID.ThreadID: SystemTime
To set the string during debugging, Use the !wdfsettraceprefix command, as follows:
-
!wdfkd.wdfsettraceprefix String
The following example sets the same string as the preceding environment variable:
-
!wdfkd.wdfsettraceprefix %2!s!: %!FUNC!: %8!04x!.%3!04x!: %4!s!:
EAN: 2147483647
Pages: 224