| Let's begin to create a better bus schedule by listing the things we should consider when designing one that will work well for everyone. Route information is presented as a set of intersections that the bus passes through at specific times. Data cells show the time when the bus will reach a specific intersection. Displayed times may extend from 4:00 or 5:00 A . M . to mid-night or later. Weekday schedules are often different from weekend schedules. Some routes do not run on Sundays and holidays, or Sunday and holiday schedules differ from weekday and Saturday schedules. Routes may be identified as northbound, southbound, eastbound, or westbound. Route numbers and names may change after buses cross specific points. (In Austin, for example, Town Lake divides north and south, while Congress Avenue is the line between east and west.) A visual map of the route may be helpful or even necessary for some passengers.
HTML Resources for Creating the Schedule Table 11-1 lists the HTML resources we can draw upon as we devise a solution. The first column lists the elements we will use. Each attribute listed in the second column applies to the element shown directly above it. The third column contains a brief description of the function of the element or attribute. Screen readers, talking browsers, refreshable Braille displays, and other user agents use these elements and attributes to render tabular information in a comprehensible form for people who either don't see the table at all or see only a small portion of it at a time. For example, screen readers and talking browsers supplement onscreen content by speaking the contents of the summary attribute and reporting the associations between data cells and column or row headers (those associations must be created with the id and headers attributes using the techniques we'll explain below). In the bus schedule we'll create, passengers who use screen readers and talking browsers will be able to read the schedule cell by cell across table rows or up and down columns to learn where and when to catch the bus. For layout tables, assistive technology devices can replace the visual display of information by reading ALT text and extended descriptions associated with images in the table graphical navigation links, for example. Table 11-1. HTML Elements and Attributes Used to Design a More Accessible Bus Schedule| Element | Attribute | Function |
|---|
| <table> | | Creates relationships between data elements by means of columns and rows. | | | summary | Encapsulates the purpose and organization of the entire table. You might think of it as ALT text for a table since it is not displayed onscreen. | | <tr> | | Defines a row of data. | | <td> | | Defines a data cell. | | | headers | Associates a data cell with a column or row header. | | <th> | | Identifies the contents of a data cell as a column or row heading. | | | id | Assigns a unique identifier for each table cell. | | <caption> | | Provides clear visual and auditory identification of the table (the contents of the <caption> element appear on the screen). | | <thead> | | Defines a row (or rows) as the table head, causing it to appear at the top of every printed page and to allow associations with data cells. | | <tbody> | | Defines the body of the table, within which the <td> elements are defined and the data are placed. | | <tfoot> | | Defines a row as the table foot, causing it to appear at the foot of every printed page. | | <abbr> | | Indicates the abbreviation of a word, the expanded version of which should be pronounced by talking browsers. (Not specific to tables.) | | <acronym> | | Designates a word formed by combining a series of the first letters of a string of words. Once defined, the letters rather than the word are pronounced. (Not specific to tables.) |
HTML Techniques for Accessible Tables We'll now introduce several of the techniques that Web developers need to create accessible tables. We'll start by showing how to identify column and row headers using the <th> element. We'll use the <td> element to identify data cells and then explain how to associate data cells with the appropriate column and row headers. We'll illustrate these techniques by using information about intersections and times, building an accessible bus schedule as we go. (The names of the intersections are real, but the schedule is imaginary.) Identifying Column Headers The technique for identifying column headers is simple and straightforward. Use the <th> element as shown in the code sample below. <table width="100%"> <tr> <th>Sixth & Congress</th> <th>Eleventh & Congress</th> <th>Twelfth & Lavaca</th> <th>Fifteenth & Lavaca</th> <th>Martin Luther King & Lavaca</th> <th>Twenty-fourth & Guadalupe</th> </tr> </table> The example above is for the first row of a table with six columns. Each column shows the name of an intersection in Austin, Texas. Visually, the name will be displayed in boldface type and will be centered inside the cell, as shown in Figure 11-2. (This is the default rendering for the <th> element. Developers can use CSS to override the default styling.) Figure 11-2. A row of intersections tagged as <th> elements. The names of the intersections are centered and boldfaced. 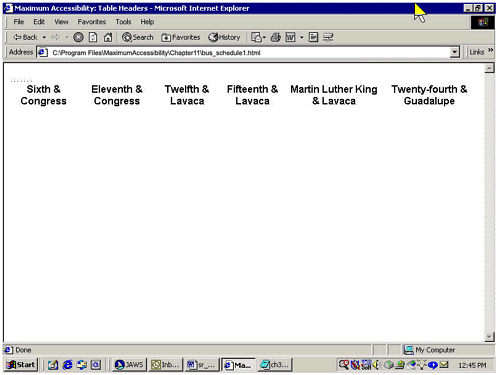 But the point isn't simply that the <th> element is visually distinct from the remaining data cells. The <th> element is also logically different: use of the <th> element indicates that this cell has a specific place in the structure of the table and "exposes" that structure to assistive technologies as well as "mainstream" tools such as Microsoft Internet Explorer, Netscape Navigator, and other browsers. Identifying Row Headers You can use the same technique to identify the first cell in a row of data cells as a row header, as shown below. <tr> <th>Row header</th> <td>Data cell</td> <td>Data cell</td> <td>Data cell</td> </tr> The first cell on this row will be formatted like those in the previous example boldfaced and centered (Figure 11-3). The remaining cells will be formatted like the data cells in the table. Again, it's worth noting that use of the <th> element here enables assistive technologies to recognize the structural role of this cell as a row header and not just an "ordinary" data cell. Figure 11-3. A table with one row. The first cell is identified as a row header and is centered and boldfaced. 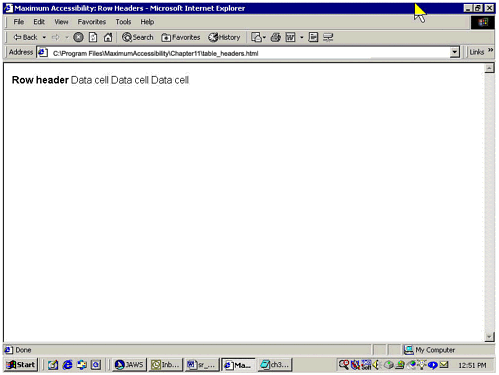 You can attach an id attribute to the row and column headers in order to associate them with specific data cells; we'll show you the technique in the section below on associating data cells with column headers. Identifying Data Cells First, though, let's add a row that shows what time the bus will reach each intersection; we'll include information about whether the time is before or after noon. We'll use the <td> element, with which you're probably familiar already. Here's the code for both rows. <table width="100%" cellspacing="0" cellpadding="0"> <tr> <th>Sixth & Congress</th> <th>Eleventh & Congress</th> <th>Twelfth & Lavaca</th> <th>Fifteenth & Lavaca</th> <th>Martin Luther King & Lavaca</th> <th>Twenty-fourth & Guadalupe</th> </tr> <tr> <td>10:33am</td> <td>10:36am</td> <td>10:42am</td> <td>10:45am</td> <td>10:50am</td> <td>10:55am</td> </tr> </table> Figure 11-4 shows how the table looks now. As in the previous example, the names of intersections are centered and boldfaced. In the second row, times are shown in regular font aligned to the left side of the cell the default rendering for the <td> element. Figure 11-4. A schedule with two rows. The first row shows intersections tagged as <th> elements. The second row shows times tagged as <td> elements. 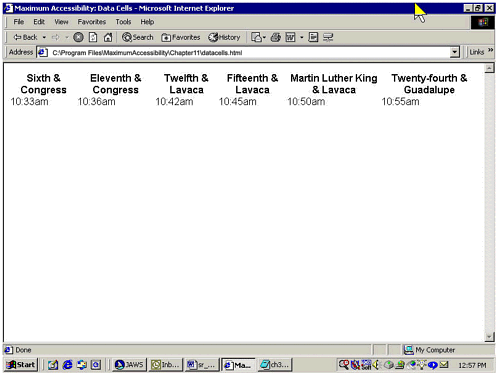 Associating Data Cells with Column Headers Many current-generation screen readers would be able to identify the appropriate column header for each data cell using only the markup shown above. But when the table has two or more logical levels, the WCAG 1.0 and Section 508 require that we use additional markup to create an explicit association between data cells and header cells. A table has two or more logical levels when, for example, it includes groups of rows or columns that contain related data. (The ground-breaking book by WAI cofounder Mike Paciello [2000], Web Accessibility for People with Disabilities, includes an excellent example of such a table: a spreadsheet listing travel expenses for multiple trips to multiple cities.) These groupings, created using attributes such as colspan and rowspan, are rendered visually on the screen; but assistive technology can't recognize and report these aspects of the document's structure without additional markup. Providing this additional markup isn't hard to do at all: it's a matter of adding appropriate attributes to the <th> and <td> elements and making sure they're properly matched up. You can do it in two steps. -
Assign an id attribute to each <th> element. <th >Sixth & Congress</th> -
Assign a matching headers attribute to each <td> element. <td headers="intersection1">10:33am</td>
Note that the headers attribute on the <td> element matches the id attribute on the <th> element. (The label for and input id pairings work the same way in forms. See Chapter 10 for details.) Assistive technology looks at the combination of id and headers attributes to determine which row and/or column heading(s) are associated with each data cell. In this case, a person using a screen reader should hear the name of the intersection, "Sixth and Congress," followed by the time, "10:33 A.M." Let's put it all together to see what the code looks like. <table width="100%"> <tr> <th >Sixth & Congress</th> <th >Eleventh & Congress</th> <th >Twelfth & Lavaca</th> <th >Fifteenth & Lavaca</th> <th >Martin Luther King & Lavaca</th> <th >Twenty-fourth & Guadalupe</th> </tr> <tr> <td headers="intersection1">10:33am</td> <td headers="intersection2">10:36am</td> <td headers="intersection3">10:42am</td> <td headers="intersection4">10:45am</td> <td headers="intersection5">10:50am</td> <td headers="intersection6">10:55am</td> </tr> </table> This additional code won't affect the way the table looks at all; only people using assistive technologies like screen readers or talking browsers would notice the difference. The same applies for the summary attribute we'll add in the next section. Identifying and Explaining the Table with a summary Attribute WCAG 1.0 Checkpoint 5.5 suggests providing a summary for the table itself. You can do this by using the summary attribute and the <caption> element (we'll explain below why it's a good idea to use both options). While this checkpoint is only a Priority 3 item (meaning that it is useful but not essential), carefully written summaries and captions can add significant value. Even with correct markup to associate data cells with headers, some people may need additional information to understand how the table is organized and of course everyone needs to know what the table is supposed to show. As a designer, you can use the summary attribute to provide this information and explain how to navigate through the table, without having to account for the additional text as part of the visual design of the page (the summary attribute does not show on the page but is intended specifically for screen readers and talking browsers). This is one key difference between the summary attribute, which is attached to the <table> element, and the <caption> element, which is an element like <th>, <td>, <tr>, and so forth (we'll discuss the <caption> element below). Like ALT text, the summary attribute is spoken by screen readers and talking browsers but doesn't appear on the screen, whereas the <caption> element is part of the onscreen text. This has implications for us as designers of a complete and satis-fying user experience. So let's use the summary attribute to associate an explanation with the table. The source code looks like this. <table width="100%" summary="The first line of this bus schedule lists selected intersections along the route, followed by the times when the bus stops at each intersection. To plan your trip, locate the intersection closest to where you want to get on the bus. Read down the column till you find the time closest to when you'd like to start your trip. Read across that row to find out when you'll reach the stop closest to your destination."> As with the addition of the id and headers attributes discussed above, adding the summary attribute won't change the way your table appears on the screen. Identifying the Table with a <caption> Element To make sure that everyone who uses your site can identify the table, include a <caption> element within the table. You can think of the <caption> element as a title for the table. The <caption> element is different than the summary attribute: first of all, it's an element in its own right rather than an attribute (though it can only exist as part of a table, like <tr>, <td>, <th>, and so forth). Second, the <caption> element appears as onscreen text, and the summary attribute is read only by assistive technologies (this may change in future browser releases). The <caption> element shouldn't be identical to the contents of the summary attribute, since people using screen readers and talking browsers would then have to listen to the same text twice. Instead, you can use the <caption> element and the summary attribute in complementary ways. The <caption> element provides information that helps all users identify the table and its purpose; the summary attribute provides additional information for people who can't pick it up from the visual organization of the data in the table. So you can use the summary attribute and the <caption> element together to make the table and its purpose clearer for all your users. Figure 11-5 shows the table from Figure 11-4 with a new <caption> element. Here's how the code looks. Figure 11-5. The table now has a <caption> element above the first row of the table. The caption reads, "Schedule for Bus from Downtown." 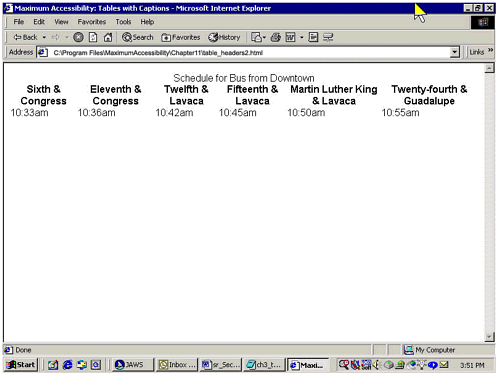 <table width="100%" cellspacing="0" cellpadding="0" summary="The first line of this bus schedule lists selected intersections along the route, followed by the times when the bus stops at each intersection. To plan your trip, locate the intersection closest to where you want to get on the bus. Read down the column till you find the time closest to when you'd like to start your trip. Read across that row to find out when you'll reach the stop closest to your destination."> <caption>Schedule for Bus from Downtown</caption> <tr> <th >Sixth & Congress</th> <th >Eleventh & Congress</th> <th >Twelfth & Lavaca</th> <th >Fifteenth & Lavaca</th> <th >Martin Luther King & Lavaca</th> <th >Twenty-fourth & Guadalupe</th></tr> <tr><td headers="intersection1">10:33am</td> <td headers="intersection2">10:36am</td> <td headers="intersection3">10:42am</td> <td headers="intersection4">10:45am</td> <td headers="intersection5">10:50am</td> <td headers="intersection6">10:55am</td> </tr></table> Using the Schedule Reading across the second row of the schedule, you stop at the time point 10:45 A.M. What intersection will the bus cross at this time? If you're a JAWS user, you can press Alt+Ctrl+NumKeypad5 to find out. Here's what you'll hear. Row 2 column 4 10:33am Fifteenth & Lavaca 10:45am
What is this? JAWS has actually gone farther than we did in coding the schedule. It has recognized the association between the time point and the intersection, in keeping with the way we matched the id and headers attributes. But it has also prefaced that information with two additional pieces of information: the row and column coordinates for the cell (row 2, column 4) and the first cell of the row. JAWS does this automatically, without any action on the user's part. This might be useful sometimes, but it can also interfere with efforts to orient users in other ways since there's no way for a person who can't see the screen to know that the number immediately following the row and column coordinates is not the data in the cell where his or her cursor is positioned. People with cognitive disabilities as well as limited or no vision might also find this extraneous auditory information confusing. So let's try a different technique. Another Look at the Bus Schedule Using the Complex Table Model The next example approaches the bus schedule in a different way, using additional features supported by HTML's Complex Table Model. This allows us to give riders the information we want to give them instead of whatever JAWS defaults to. Using the <thead> Element The code below uses a <thead> or table head element, which includes two rows (<tr>) of <th> elements. The first row spans all six columns and shows the direction in which the bus will travel. The second row contains the names of the intersections along the route. The <thead> element is then closed with the </thead> tag. Here is the code. <thead> <tr> <th colspan="6" >Northbound</th> </tr> <tr> <th >Sixth & Congress</th> <th >Eleventh & Congress</th> <th >Twelfth & Lavaca</th> <th >Fifteenth & Lavaca</th> <th >Martin Luther King & Lavaca</th> <th >Twenty-fourth & Guadalupe</th> </tr> </thead> Using the <tbody> Element Next comes a new table body element (<tbody>), which contains the data cells (<td>). Note that the contents of the headers attribute for each data cell now include two headers, the direction (dir) and the intersection. <tbody> <tr> <td headers="dir intersection1">10:33am</td> <td headers="dir intersection2">10:36am</td> <td headers="dir intersection3">10:42am</td> <td headers="dir intersection4">10:45am</td> <td headers="dir intersection5">10:50am</td> <td headers="dir intersection6">10:55am</td> </tr> </tbody> On the screen, the cells in the <tbody> element look exactly as they did in the table shown in Figure 11-5. Viewing the Improved Table Incorporating these changes into our table gives us the following code. <table width="100%" cellspacing="0" cellpadding="0" summary="The first line of this bus schedule lists selected intersections along the route, followed by the times when the bus stops at each intersection. To plan your trip, locate the intersection closest to where you want to get on the bus. Read down the column till you find the time closest to when you'd like to start your trip. Read across that row to find out when you'll reach the stop closest to your destination."> <caption>Schedule for Bus from Downtown</caption> <thead> <tr> <th colspan="6" >Northbound</th> </tr> <tr> <th >Sixth & Congress</th> <th >Eleventh & Congress</th> <th >Twelfth & Lavaca</th> <th >Fifteenth & Lavaca</th> <th >Martin Luther King & Lavaca</th> <th >Twenty-fourth & Guadalupe</th> </tr> </thead> <tbody> <tr> <td headers="dir intersection1">10:33am</td> <td headers="dir intersection2">10:36am</td> <td headers="dir intersection3">10:42am</td> <td headers="dir intersection4">10:45am</td> <td headers="dir intersection5">10:50am</td> <td headers="dir intersection6">10:55am</td> </tr> </tbody> </table> Figure 11-6 shows how the new table looks. Note that there are now two header rows as well as a caption. Figure 11-6. The bus schedule table created by using the Complex Table Model. The <thead> element includes two header rows. The <td> elements in the <tbody> element refer to header cells identifying both the intersection and the direction the bus is traveling. 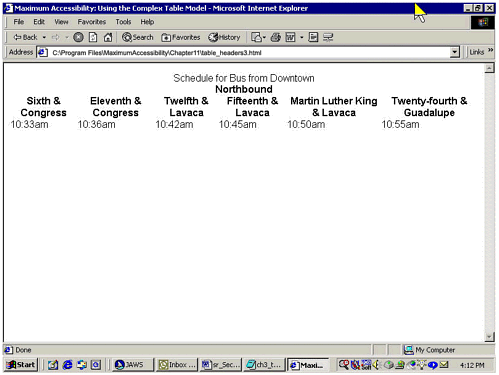 What's the Point? The point is that screen readers and talking browsers can now tell their users what direction the bus is traveling as well as what intersection it will reach at the designated time. This may seem like a small thing but for someone who can't scan visually up the column to check the name of the intersection and the direction of the route, or for a person with short-term memory limitations, it might be an enormous time-saver. You can apply this technique to far more complicated tables that represent several layers of relationships. Using Additional WCAG Checkpoints to Enhance Accessibility and Usability Well-designed Web pages that present accessible, well-designed tables almost always include other elements (navigation bars, graphics, text, and so on). Keeping accessibility in mind as you select and design those other elements will ensure that the effort you put into making your tables accessible won't be wasted. In the next few sections, we'll show you some additional WCAG checkpoints that can help you improve the accessibility and overall usability of pages that include tables like the bus schedule we've been discussing. First, though, let's talk a little about the relationship between WCAG 1.0 and the Section 508 Web accessibility standards, so you can see how they're similar and how they differ. Where tables are concerned, there are no substantive differences between WCAG Checkpoints 5.1 and 5.2 and the Section 508 standards in paragraphs (g) and (h). Yet in the aggregate, WCAG 1.0 provides more guidance for Web designers not only in what it says about tables but also in what it says about other issues on which Section 508 is more or less silent. Frequently, also, WCAG 1.0 hints at aesthetic concerns that are deliberately excluded from the regulatory language of Section 508. For example, all of Guideline 5 applies to tables: "Create tables that transform gracefully." In other words, as an informative note in the Guidelines document explains, designers should "Ensure that tables have [the] necessary markup to be transformed by accessible browsers and other user agents." Checkpoints 5.1 and 5.2 (which form the basis of the Section 508 standards) indicate two of the ways in which HTML can support graceful transformation by identifying row and column headings, then creating an explicit programmatic association between data cells and specific headings by coupling id attributes attached to <th> elements with headers attributes for <td> elements. We have also seen the value of Checkpoint 5.5, which calls on us to use the summary attribute and/or the <caption> element. Let's look at how some other checkpoints might apply to table construction. Other Applicable Checkpoints and Guidelines for Accessible Table Design Checkpoint 5.6: Use <abbr> and <acronym> Elements. Checkpoint 5.6 suggests using the abbreviation element (<abbr>) to help people using screen readers and talking browsers make sense of the terse abbreviations sometimes imposed on designers by the visual constraints of the screen. This is another Priority 3 item, but it would be very helpful for riders trying to determine which intersections the bus crosses. In fact, we have never seen bus schedules where the stops are written out in the manner of the example we have been using. Unfortunately, as of this writing, screen readers and talking browsers do not yet support the automatic expansion of the <abbr> and <acronym> elements. (Expansion, in this context, means that the screen reader or talking browser speaks the full name instead of the abbreviation.) But that doesn't mean you have to give up on this point. Designers of the bus schedules on the Santa Clara Valley Transportation Authority site we discussed in Chapter 5 used a separate table of listings to identify intersections whose names are abbreviated in the schedule itself (see Figure 5-14). Such separate tables are a stopgap measure at best; they may be necessary, however, until assistive technology supports <abbr> and <acronym>. Guideline 12: Provide Context and Orientation Information. Web pages that display bus schedules and similar information are often dynamically generated. That is, the user's request to see the schedule for a particular route activates a script that retrieves the relevant data from a large database and displays it at predetermined places in a reusable template. Such dynamically generated pages often have generic titles ("Routes and Schedules," for example) rather than specific ones that clearly and accurately identify the material that is currently being displayed ("Schedule for Route 7 Duval," for instance). There is no guideline or standard that addresses precisely this problem: neither WCAG 1.0 nor Section 508 explicitly mandates providing informative titles for individual pages. In our view, however, accurate, meaningful titles for all pages on the site are essential context and ori-entation aids for users with and without disabilities: good titles help all of us maintain confidence that we have chosen the right links and found the pages we want. The Babylon Village schedule page discussed in Chapter 5, for example, is clearly titled, "Babylon Village Railroad Schedule" (see Figure 5-10). Guideline 13: Provide Clear, Consistent Navigation. WCAG 1.0 Guideline 13, which has no real counterpart in the Section 508 Web standards, stipulates that designers should "Provide clear navigation mechanisms." An explanatory note in the Guidelines document adds that devices such as navigation bars, site maps, and orientation information are not only important for users who are blind or visually impaired but also helpful for all users. Consistency, the guideline editors add, is especially vital for people who have cognitive difficulties (Checkpoint 13.4). The Whole Enchilada, One More Time Finally, let's look at the whole table again, using the additional suggestions from the WCAG 1.0 checkpoints. The revised code appears below. <!DOCTYPE HTML PUBLIC "-//W3C//DTD HTML 4.01 Transitional//EN"> <html lang="EN-US"> <head> <meta http-equiv="Content-Type" content="text/html; charset=iso-8859-1"> <title>Imaginary Bus Company Route 7 Bus Schedule</title> </head> <body> <p>The following bus schedule uses abbreviated street names. They are explained in the <a href="#legend"> legend </a> below.</p> <table width="100%" summary="This bus schedule lists selected intersections along the route, followed by the times when the bus stops at each intersection. To plan your trip, locate the intersection closest to where you want to get on the bus. Read down the column till you find the time closest to when you'd like to start your trip. Read across that row to find out when you'll reach the stop closest to your destination."> <caption>Schedule for Bus from Downtown</caption> <thead> <tr><th colspan="9" >Northbound</th></tr> <tr><th >6th & <abbr title="Congress Avenue">Con</abbr></th> <th >11th & <abbr title="Congress Avenue">Con</abbr></th> <th >12th & <abbr title="Lavaca Street">Lav</abbr></th> <th >15th & <abbr title="Lavaca Street">Lav</abbr></th> <th >MLK & <abbr title="Lavaca Street">Lav</abbr></th> <th >24th & <abbr title="Guadalupe Street">Gua</abbr></th> <th >28th & <abbr title="Guadalupe Street">Gua</abbr></th> <th >32nd & <abbr title="Guadalupe Street">Gua</abbr></th> <th >32nd & <abbr title="Rio Grande">Rio</abbr></th></tr> </thead> <tbody> <tr> <td headers="dir intersection1">10:33am</td> <td headers="dir intersection2">10:36am</td> <td headers="dir intersection3">10:42am</td> <td headers="dir intersection4">10:45am</td> <td headers="dir intersection5">10:50am</td> <td headers="dir intersection6">10:55am</td> <td headers="dir intersection7">11:03am</td> <td headers="dir intersection8">11:11am</td> <td headers="dir intersection9">11:17am</td></tr> <tr><td headers="dir intersection1">10:48am</td> <td headers="dir intersection2">10:51am</td> <td headers="dir intersection3">10:57am</td> <td headers="dir intersection4">11:00am</td> <td headers="dir intersection5">11:05am</td> <td headers="dir intersection6">11:10am</td> <td headers="dir intersection7">11:18am</td> <td headers="dir intersection8">11:26am</td> <td headers="dir intersection9">11:32am</td></tr> <tr><td headers="dir intersection1">11:03am</td> <td headers="dir intersection2">11:06am</td> <td headers="dir intersection3">11:12am</td> <td headers="dir intersection4">11:15am</td> <td headers="dir intersection5">11:20am</td> <td headers="dir intersection6">11:25am</td> <td headers="dir intersection7">11:33am</td> <td headers="dir intersection8">11:41am</td> <td headers="dir intersection9">11:47am</td></tr> </tbody> </table> <p></p> <table width="75%" summary="This table lists the abbreviated street names that are in the bus schedule, and gives the full street names. The abbreviations are listed in alphabetical order."> <caption><a name="legend">Legend of Abbreviations for Street Names</a></caption> <thead> <tr> <th >Abbreviated Street Name</th> <th > Full Street Name</th></tr> </thead> <tbody> <tr><td headers="T1"> MLK</td> <td headers="T2"> Martin Luther King Boulevard</td></tr> <tr><td headers="T1"> Con</td> <td headers="T2"> Congress Avenue</td></tr> <tr><td headers="T1"> Gua</td> <td headers="T2"> Guadalupe Street</td></tr> <tr><td headers="T1"> Lav</td> <td headers="T2"> Lavaca Street</td></tr> <tr><td headers="T1"> Rio</td> <td headers="T2"> Rio Grande</td></tr> </tbody> </table> </body> </html> The output of this code appears in Figure 11-7. Figure 11-7. Screen shot of the imaginary bus schedule, including abbreviated intersection names and a table of abbreviations. 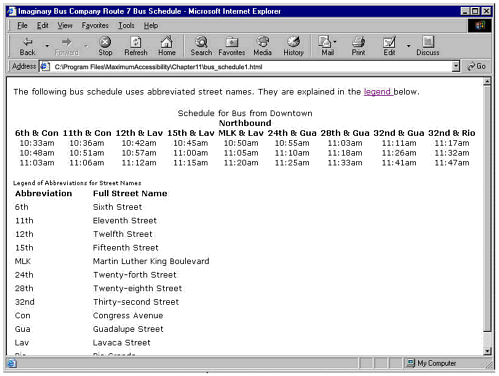 While this is clearly a rudimentary schedule, it does demonstrate the principles we have been discussing in this chapter. A couple of things are worth noting. First, the source code above contains only structural markup; presentation and layout could be taken care of with a style sheet (see Chapter 15 for discussion of Cascading Style Sheets). In addition, several of the accommodations we have made for people who use screen readers, talking browsers, or refreshable Braille displays do not show up on the screen at all. Both tables (the schedule and the list of abbreviations) include summary attributes that provide screen readers with information to help users access the schedule more effectively. The <abbr> element has been used; when assistive technologies support these elements, people using screen readers, talking browsers, and refreshable Braille displays will be able to read the full street names as well as the row and column headers all without distracting sighted users. To complete the design, we might consider using color differences to make it easier for sighted passengers to visually identify different areas of the schedule, such as morning and afternoon; a style sheet would be an excellent way to do this. We might supply route maps to allow riders with cognitive difficulties or low literacy skills to plan their travel more efficiently. And we might consider including anchor links to allow riders to go directly to relevant portions of the schedule (weekdays and weekends, for example) or to specific time points. In fact, the route maps could be effectively converted to client-side image maps, with links from each labeled stop to the timetable for that intersection; for passengers who cannot read maps or those who have trouble building a mental map of the route (including people new to the city or unfamiliar with the area they're going to), a narrative description of the route would be helpful as well (the Santa Clara Valley Transportation Authority makes such narrative descriptions available, as noted in Chapter 5). Cost Saver One more note: On many contemporary sites, things like bus schedules are generated automatically on demand by powerful scripts that retrieve up-to-the-minute information from a database and display it using a template created for that purpose. These scripts can automate the process of generating and matching id and headers attributes to create the necessary associations, saving developers countless hours of tedious repetition and avoiding countless tiny and nearly undetectable errors. The result is an enhanced user experience and better service for your customers and constituents. |