Understanding Output Options on the Selection Screen
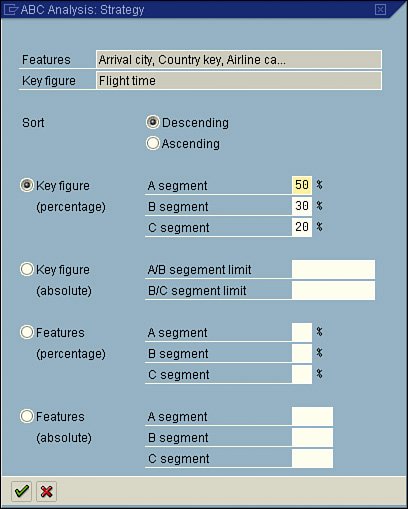
| As mentioned earlier in this chapter, the values on your selection screen vary, based on the logical database selected in your report's InfoSet. However, one item is standard on all selection screens: the Output Format section (see Figure 5.8). Figure 5.8. The Output Format section of the screen is where you identify the desired format you prefer for the specified report.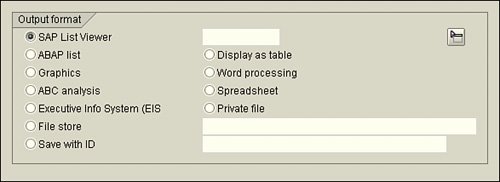 By default, in version 4.6C of SAP and higher, SAP List Viewer is the selected option for almost all reports. The SAP List Viewer was introduced in version SAP GUI 4.6C as an easier way to review and work with reports in a table view (similar to Microsoft Excel). In releases prior to 4.6C, the SAP List Viewer was called the ABAP List Viewer (ALV). Figure 5.9 shows an example of an SAP test flight scheduling system report displayed in the SAP List Viewer. Figure 5.9. In versions of SAP earlier than 4.5, the standard display was in an ABAP list, without the table view. In versions of SAP earlier than version 4.5, the second option in the Output Format list, ABAP List, was the default view. Figure 5.10 shows an example of the same SAP test flight scheduling system report shown in Figure 5.9, but this time displayed in ABAP list view. Figure 5.10. Without previously indicating any special formatting, the report text is likely to wrap to the next line at 80 characters.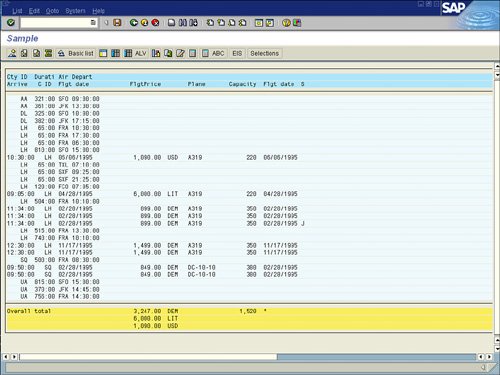 Chapter 6, "Using Reporting Selection Screens: Advanced Skills," discusses advanced query-based reporting options, including how to vary the output of your data when it is displayed in a basic list. The third option in the Output Format section, Graphics, is tied to the Business Graphics application in SAP, which is designed to allow you to create reports in a variety of different graphical formats. Simply selecting the Graphics option launches Business Graphics. When you select the Graphics option, SAP graphs the first numeric listing. Figure 5.11 shows an example of the same SAP HCM report from the preceding figures, this time displayed in graphical format. Figure 5.11. There are multiple options for graphical reporting, including pie charts and polar diagrams.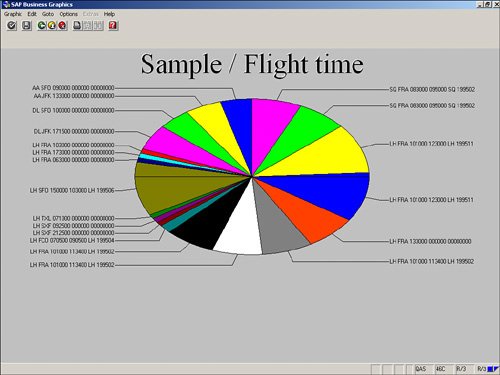 The fourth available option in the Output Format section is ABC Analysis. When you select this option, a dialog box labeled ABC Analysis: Strategy appears (see Figure 5.12). Figure 5.12. ABC Analysis can also be performed on SAP data in Microsoft Excel. You can use the ABC Analysis: Strategy dialog box to stipulate how many data records a group (A, B, or C segment) is to contain. An ABC analysis divides the records of a dataset into three distinct segments (A, B, and C). These records must each contain a key figure (a numeric field) and any number of attributes (nonnumeric fields). The dataset is first sorted in descending or ascending order, using the key figure. This function can be used for any single-line basic lists, statistical lists, and any ranked lists that contain at least one numeric field. ABC analysis is most popular in financial-type analysis. Helpful Hint With the key figure strategy of ABC analysis, the percentage proportion of the key figure total must correspond to the overall total in this specification. With the attribute strategy, the percentage proportion of the number of data records must correspond to the total number of data records in this specification. For example, if the specifications are A = 50%, B = 30%, and C = 20%, the transition from the A segment to the B segment applies when the percentage proportion exceeds 50. The transition from the B segment to the C segment applies when the percentage proportion exceeds 80 (50+30). The next available output option is Executive Info System (EIS). This option is not utilized very often because it requires that an interface and separate database structure be in place. Indicating this output format in your SAP query provides a link to the EIS and, via an interface, transfers the report data to the EIS database for further analysis. Upon activation, a dialog box offers additional selections for formatting, sending, and storing the data. The next option in the Output Format section is Display as Table. This option displays your report output in an SAP table control. It does not have the advanced functionality that the SAP List Viewer has, but it presents the data in a table format, which makes it easy to read. Figure 5.13 shows the same SAP HCM report shown earlier, this time displayed after the Display as Table option is selected. Figure 5.13. The application toolbar contains various options but not as many as with the SAP List Viewer option.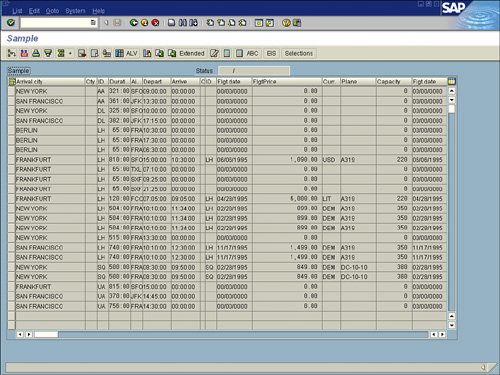 You use the next available option in the Output Format section, Word Processing, to create a Microsoft Word form letter with the data from your SAP query. Creating form letters using your SAP data and Microsoft Word is discussed at length in Chapter 22, "SAP Query Reporting with Microsoft Word and Outlook." Chapter 21, "SAP Reporting with Microsoft Excel," provides an overview of using SAP with Microsoft Excel. When you select the Spreadsheet option in the Output Format section, a dialog box appears, asking which of the following formats you want to use for the spreadsheet:
Helpful Hint If you ever experience a problem getting your SAP and Microsoft Excel applications to work in harmony, be sure to confirm that your Excel security is set to Medium. To do so in Microsoft Excel 2003, follow these steps:
Figure 5.14 shows an example of the same SAP test flight scheduling system report as before, this time displayed in spreadsheet (PivotTable) format. Figure 5.14. PivotTables in Microsoft Excel allow for instant analysis of the report data, and the raw, unformatted data can be found on a separate sheet in the existing workbook.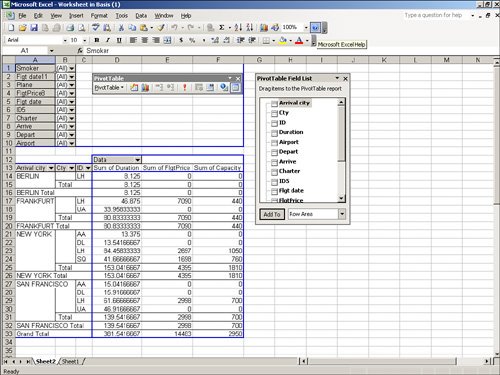 The Private File option in the Output Format section passes the report directly to a function module upon report execution instead of displaying it onscreen. This SAP enhancement is virtually obsolete. SAP continues to support this option for compatibility, but SAP recommends that you not use it and that you redefine any private files currently in use to other formats. (Please see the SAP Help if you require more information.) The File Store option in the Output Format section allows you to select a destination and filename for your report output to be sent to. This option is popular for scheduled reports that are run in the background. To use this function, you simply type a destination address (for example, c:\filename.asc) in the blank input field next to File Store. Files can be stored in the following formats:
The last available option in the Output Format section is Save with ID. To use this option, you type a user ID in the blank field next to File Store, and the list is then saved under that designated ID. In the Output Format section, often by default all the options with the exception of the default are hidden. To see the full list, select the expand arrow to the far right of the SAP List Viewer radio button. Why Do the Output Format Options Look Familiar?The options in the Output Format section look familiar because they are the same as the options that are available in the Output Format section on the Title, Format screen of the SAP Query tool (see Figure 5.15). Figure 5.15. The Output Format options for a SAP query are available in at least two places in the SAP Query tool: on the Title, Format screen and on the report's selection screen, which is visible upon report execution.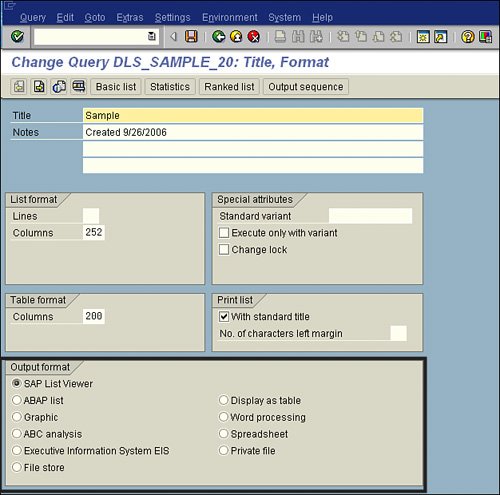 The Output Format options are available in two places. Which section works betterthe Title, Format screen of the SAP Query tool or the report's selection screen? If no variant is set (variants are discussed in Chapter 6), the report output value indicated on the Title, Format screen is automatically used in the Output Format section on the report's selection screen when the report is executed. However, you can override those settings on the selection screen before final execution and display of the report output. |