Monitoring and Troubleshooting Performance
|
We mentioned previously the importance of matching the model of PIX firewall you deploy to the demands you place on it. You need to consider several factors in addition to the amount of traffic you are passing. Table 11.3 summarizes the loads that each model can handle, including information about encryption. Ensure that your design considers these load limits.
| Model | Hardware Maximums (CPU/SDRAM/FLASH) | Clear-text Throughput | DES IPsec Throughput | 3DES IPsec Throughput | Simultaneous VPN Tunnels |
|---|---|---|---|---|---|
| 501 | 133MHz AMD SC52016MB RAM 8MB Flash | 10Mbps | 6Mbps | 3Mbps | 5 peers |
| 506E | 300MHz Intel Celeron 32MB RAM 8MB Flash | 20Mbps | 20Mbps | 16Mbps | 25 peers |
| 515E | 433MHz Intel Celeron 64MB RAM 16MB Flash | 188Mbps | 33–120Mbps | 63Mbps UR 22Mbps R | 2000 |
| 525 | 600MHz Intel Pentium III 256MB RAM 16MB Flash | 360Mbps | 120–140Mbps | 70Mbps | 2000 |
| 535 | 1GHz Intel Pentium III 1GB PC133 RAM 16MB Flash | 1Gbps | 200Mbps | 100Mbps | 2000 |
The FWSM 1.1 for the Catalyst 6500 series switches is a high-performance device with support for 5Gbps of aggregated traffic. It does not support IPsec VPN connections.
Three key components of the PIX firewall that affect performance are the CPU, memory, and network interfaces. You need to understand how to monitor these components and ensure that their load is not reaching the limits. We discuss the monitoring of these three components in the following sections. The ultimate question is, can your firewall handle the loads you will place on it?
CPU Performance Monitoring
Your CPU does it all: passes traffic, creates VPN tunnels, and performs encryption on demand. The rule of thumb is that during normal operational mode, the CPU load should stay below 30 percent, on average. During peak traffic hours and attacks, you will see the CPU surge up higher, but that is normal. However, if the CPU utilization consistently stays above 30 percent with normal network activity, consider upgrading to a more powerful model.
Many functions can tax CPU, but encryption (DES and 3DES) has the biggest potential to consume your CPU's precious time. If you are going to deploy a large number of encrypted tunnels (VPNs), we recommend you monitor the processor carefully. If utilization goes high, consider adding a card to the PIX to handle VPN functions (the VPN Accelerator Card). Alternatively, you can think about offloading VPN functions from the PIX to a dedicated VPN concentrator (such as the VPN 3000 series from Cisco). The amount of traffic passing through the firewall is also a factor. If you are seeing high traffic utilization, monitor the CPU utilization on a regular basis to ensure that it is not peaking. The best way to do this is to use a tool such as MRTG or HP OpenView to monitor the CPU through SNMP.
Logging and the excessive use of debug commands also affect CPU utilization. To avoid consuming precious CPU cycles, you should set logging to the minimum level of information that you actually need. Table 11.4 displays the logging levels you have at your disposal. If there is a reason you need high logging levels, consider turning off log messages that you do not need using the no logging message.
| Description | Numerical Value |
|---|---|
| Emergency | 0 |
| Alert | 1 |
| Critical | 2 |
| Error | 3 |
| Warning | 4 |
| Notification | 5 |
| Informational | 6 |
| Debugging | 7 |
You can determine the logging options and levels that are enabled on a PIX firewall using the show logging command. For example, on this firewall, all logging is disabled:
PIX1# show logging Syslog logging: disabled Facility: 20 Timestamp logging: disabled Standby logging: disabled Console logging: disabled Monitor logging: disabled Buffer logging: disabled Trap logging: disabled History logging: disabled
The show cpu usage Command
The show cpu usage command provides a snapshot of the short-term CPU utilization statistics. Although this information is not useful for history or trending purposes, it can immediately inform you if the CPU is overloaded at the time the command is executed. This command does allow you to check in real time if the CPU is the cause of any performance degradations. For example:
PIX1# show cpu usage CPU utilization for 5 seconds = 2%; 1 minute: 1%; 5 minutes: 1%
If you suspect that IPsec encryption is causing performance degradation, use this command before turning on encryption to take a baseline of CPU utilization. Then enable IPsec and run the command again. Compare the CPU utilization. Run the command a few times over a time interval to ensure that the data you gathered is accurate.
The show processes Command
If CPU utilization is high, you will often need much more detail than the show cpu usage command provides. This is where the show processes command comes in. This command identifies every process running on the PIX firewall, how much memory is it using, and CPU cycles. This information is collected from the time the PIX firewall was started. As shown in Figure 11.16, the output of this command is voluminous; in fact, this is an abbreviated listing of the actual output from a PIX 501 firewall, the lowest end of the PIX firewalls. Here we do not explain every row of this of the display, but we do discuss how to interpret what you see in the columns. A detailed analysis of this command is available on Cisco's Web site at www.cisco.com/warp/public/110/_pix_shproc.html.
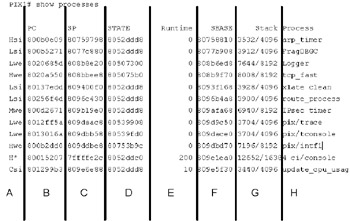
Figure 11.16: Output of the show processes Command
The first character of the first column refers to the priority of the process, which (ranked highest to lowest) can be: Critical, High, Medium, or Low. The next two characters refer to the current operating state of the process, which can be any of the values shown in Table 11.5.
| Value | Description |
|---|---|
| * | The process is currently running. |
| E | The process is waiting for an event to occur. |
| S | The process is ready to run—gave up processor time slice (idle). |
| rd | The process is ready to run—conditions for activation have occurred. |
| we | The process is waiting for an event. |
| sa | The process is sleeping until an absolute time. |
| si | The process is sleeping for a given time interval. |
| sp | The process is sleeping for a given time interval (alternate). |
| st | The process is sleeping until a timer expires. |
| hg | The process is hung and will never run again. |
| xx | The process has terminated but has not been deleted. |
The next column (PC) is the program counter, and the one after it (SP) is the stack pointer. Column D (STATE) identifies the thread queue used by the process. The thread queue may be shared with other processes. The fifth column (Runtime) is how much CPU time in milliseconds the process has consumed since it started. The Stack Base Address (SBASE) column shows the starting address space for the process, and the Stack column shows the ratio of used and total stack space in bytes allocated to the process. Bad processes will attempt to invade the space used by other processes. The last column (Process) identifies the process name.
This command is very useful to determine the processes that are taking up too many CPU cycles. To figure this out, issue the show processes command twice, waiting about one minute in between. For the process that you suspect to be a problem, subtract the Runtime value from the second command from the Runtime value from the first command. The result indicates the amount of CPU time (in milliseconds) the processed has received during that one minute. It is important to understand that some processes are scheduled to run at certain times, and others only run when they have information to process. The 577 poll process typically has the largest runtime of all processes because this is the one that polls Ethernet interfaces to see if they have any data that needs to be processed.
The show perfmon Command
One extremely useful command for performance monitoring on the PIX firewall is the show perfmon command. It shows details a number of statistics, including translations, connections, fixup, and AAA. This is the only command that you can use to view the "average" values for the number of translations and connections on the firewall. The nice thing about this command is that it breaks the connections down by protocol, as shown in the following output. This breakdown can help you determine if a particular connection is using up too much CPU or memory. Table 11.6 lists the values in the show perfmon command.
PIX1# show perfmon PERFMON STATS: Current Average Xlates 0/s 0/s Connections 0/s 0/s TCP Conns 0/s 0/s UDP Conns 0/s 0/s URL Access 0/s 0/s URL Server Req 0/s 0/s TCP Fixup 0/s 0/s TCPIntercept 0/s 0/s HTTP Fixup 0/s 0/s FTP Fixup 0/s 0/s AAA Authen 0/s 0/s AAA Author 0/s 0/s AAA Account 0/s 0/s
| Parameter | Description |
|---|---|
| Xlates | Translations built up per second. |
| Connections | Connections established per second. |
| TCP Conns | TCP connections per second. |
| UDP Conns | UDP connections per second. |
| URL Access | URLs (Web sites) accessed per second. |
| URL Server Req | Requests sent to Websense/N2H2 per second (requires the filter command). |
| TCP Fixup | Number of TCP packets that the PIX forwarded per second. |
| TCP Intercept | Number of SYN packets per second that have exceeded the configured embryonic limit. |
| HTTP Fixup | Number of packets destined to port 80 per second (requires the fixup protocol http command). |
| FTP Fixup | FTP commands inspected per second. |
| AAA Authen | Authentication requests per second. |
| AAA Author | Authorization requests per second. |
| AAA Account | Accounting requests per second. |
As with any measurement, if you do not have a baseline, this type of information is useless. Execute the command on a regular basis over time to build a baseline. You can then compare values to this baseline to find anomalies.
Memory Performance Monitoring
Memory utilization can be as important in determining performance as the CPU. Flash memory is used to hold the PIX operating system and configuration. Unless you have a very large software image, allocation issues with flash memory are not a concern.
Main memory, the focus of this section, is the working space of the PIX firewall. When the PIX firewall first boots, it loads the OS by copying it from flash to main memory. The memory is also used for all processes as well as buffering incoming and outgoing traffic. Because it is used by so many different aspects of the firewall, it is critical to ensure that you have enough memory. You can run several commands to help with this task. In addition, similar to CPU utilization, we recommend using an SNMP tool such as MRTG or HP OpenView to monitor the amount of available memory on the PIX firewall.
The show memory Command
The show memory command provides an easily comprehensible overview of how much memory is installed and how much is currently being used. This command simply shows you the amount of total and free memory at the time that you run the command. Here is an example of the show memory command:
PIX1# show memory 16777216 bytes total, 4517888 bytes free
To optimize the usefulness of this command, run it on a PIX firewall that has a very basic configuration. That is, run it on a PIX firewall that is not running encryption or other functions and record that information. Then as you add features, execute the command and compare the output. Doing so enables you to record approximately how much memory is consumed by each process.
The show xlate Command
One process that consumes memory is address translation. Each translation requires approximately 56 bytes of memory. Knowing this, you can run the show xlate command. For example:
PIX1# show xlate 100 in use, 341 most used
Multiply the number of translations by 56 bytes to determine how much memory has been consumed for translations. In our example, we have 100 translations in use, which means we have 5600 bytes of memory allocated for translation alone.
The show conn Command
Each connection made to the firewall also consumes memory. The amount of memory consumed depends on the type of connection. A UDP connection consumes 120 bytes; a TCP connection requires 200 bytes. This memory consumption is necessary to build the connection and maintain state information. Here is an example of the show conn command:
PIX1# show conn 2 in use, 2 most used
If we have 100 TCP connections made through this PIX firewall, that will require 20K of main memory. Of course, this is a transitory number and will fluctuate depending on the time of day.
The show block Command
The PIX firewall reserves certain amounts of memory to handle special traffic after the configuration is loaded and running and before any other memory allocation occurs. Certain amounts of memory are allocated into variable byte-sized blocks. Predefining such set-sized blocks relieves the firewall from having to carve memory on the fly. You can use the show blocks command to view the currently set block sizes. For example:
PIX1# show blocks SIZE MAX LOW CNT 4 1600 1563 1600 80 400 386 400 256 500 143 500 1550 1700 1102 1315 16384 8 8 8
We need to clarify the output of this command starting with the SIZE column, which is measured in bytes. The 4-byte blocks are reserved for certain traffic types such as DNS, IKE, TFTP (traffic that is small and bursty). The 80-byte blocks are used to store failover hellos and TCP intercept acknowledgments. The 256-byte blocks store stateful failover messages. The 1550-byte blocks support Ethernet (10 and 100) packets as they pass through the firewall. The 16384-byte blocks will never be used unless you have Gigabit Ethernet interfaces, something you will only see on high-end firewalls.
The MAX column identifies the maximum number of each type of memory blocks available. The LOW column indicates the lowest number of blocks that have been available since the firewall booted. Stated mathematically, subtract LOW from MAX to get the maximum number of blocks that were used at any particular time. The CNT column shows the available number of blocks. Use the clear blocks command to reset the LOW and CNT counters.
Network Performance Monitoring
Congested network interfaces can degrade overall performance. You need to ensure that the interfaces on your PIX firewall can handle the demands placed on them. Cisco offers several commands to check the status of your interfaces.
The show interface Command
One such command is show interface. You can check how much bandwidth is being consumed and check a myriad of error counters. We discussed show interface previously in the chapter, and will not rehash what has already been covered.
The show traffic Command
You can narrow your focus to capture the specific number of packets and bytes that are transiting each interface on the PIX firewall. The show interface command provides similar information, but you have to make it a specific point to zoom in on that information to determine exactly the amount of traffic being passed on a per-interface basis.
The show traffic command provides statistics on the number of packets and bytes passed through each interface. As you can see in the following output, show traffic tells you how long the interface has been in operation (either the firewall below has been in operation almost three hours or that much time has elapsed since the clearing of the statistics). The command output displays the amount of traffic transmitted and received in that amount of time.
PIX1# show traffic outside: received (in 10035.150 secs): 2 packets 678 bytes 0 pkts/sec 0 bytes/sec transmitted (in 10035.150 secs): 14 packets 1026 bytes 0 pkts/sec 0 bytes/sec inside: received (in 10035.150 secs): 0 packets 0 bytes 0 pkts/sec 0 bytes/sec transmitted (in 10035.150 secs): 15 packets 900 bytes 0 pkts/sec 0 bytes/sec
You can reset the traffic counters using the clear traffic command, which resets the counters to 0.
Identification (IDENT) Protocol and PIX Performance
There is one particular protocol that we need to address because it affects PIX performance. This is the identification protocol specified in RFC1413. The purpose of this protocol is to enable HTTP, FTP, or POP servers to confirm the identity of clients. When a client connects to one of these ports, a server running IDENT will attempt to connect to TCP port 113 on the client. If successful, the server will read certain identifying data from the client machine. In theory, this process would reduce spam or illegitimate usage by forcing users to connect from legitimate sources. In practice, the IDENT protocol can be circumvented easily.
Users behind a PIX firewall are protected from IDENT by default. Since the IDENT protocol provides information about the user, it can provide details about the internal network, which can be a violation of your security policy. The PIX firewall, like any good firewall, prevents this passage of internal details to the outside. However, the downside of this protection is that users could perceive a very noticeable delay in the server responding to their requests as it attempts to check their identities, or they could even experience a total lack of response.
To identify IDENT issues, set logging to the debugging level. Once that is turned on, you will see denied TCP attempts to port 113 attempts. To get around this issue, you have the following choices:
-
You can contact the administrator of the server running IDENTD and have it turned off. However, you will have to do this for each server that has this problem.
-
You can pass IDENT traffic through your firewall unmolested by permitting it with access lists or conduits. This would pass internal network details to the outside, which can compromise security.
-
Another (the recommended) solution is to use the service resetinbound command. This command sends a TCP reset (RST) to the IDENT server, which essentially tells it that the client does not support IDENT. Upon receiving that reset, the server provides the requested service to the user. Once this command is entered, the PIX firewall starts sending resets to traffic not permitted by the security policy rather than dropping it silently and causing the user to incur a time penalty.
|
EAN: 2147483647
Pages: 240