Section 16.11. Using Visual Explain to Examine Access Plans
16.11. Using Visual Explain to Examine Access PlansOnce the EXPLAIN data has been stored in the explain tables, it can be queried or displayed using Visual Explain or other explain tools. This section describes how to use the Visual Explain tool to review and analyze an access plan. Visual Explain is a graphical utility that gives the database administrator or application developer the ability to examine the access plan determined by the optimizer. Visual Explain can only be used with access plans explained using the snapshot option. You can use Visual Explain to analyze previously generated explain snapshots or to gather explain data and explain dynamic SQL statements. If the explain tables have not been created when you start Visual Explain, it will create them for you. You can invoke Visual Explain either from the Command Center or Control Center. From the Control Center interface, right-click on the database where your explain snapshots are stored. The Explain SQL... option lets you gather explain data and show the graphical representation of a dynamic SQL statement. This is the easiest way to explain a single SQL statement. Choosing the option Show Explained Statements History opens a window that lists all of the explained statements. In this view you will see the SQL statements and their cost in timerons (an estimate of database resources). To examine an access plan in detail, double-click on the explained statement or highlight the entry of interest and use the menu to select Statement Show access plan in the Explained Statements History window. All of the explain statements will be displayed in the Explained Statements History list, but only the explained statements with EXPLAIN SNAPSHOT information can be examined using Visual Explain. The Visual Explain output displays a hierarchical graph representing the components of an SQL statement. Each part of the query is represented as a graphical object. These objects are known as nodes. There are two basic types of nodes:
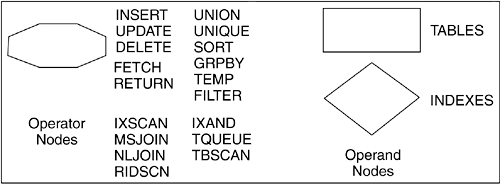
There are many operators that can be used by the DB2 UDB optimizer to determine the best access plan. Figure 16.17 shows some of the operators used by Visual Explain. These operators indicate how data is accessed (IXSCAN, TBSCAN, RIDSCN, IXAND), how tables are joined internally (MSJOIN, NLJOIN), and other factors, such as if a sort will be required (SORT). You can find more information about the operators in the Visual Explain online help. The objects shown in a Visual Explain graphic output are connected by arrows showing the flow of data from one node to another. The end of an access plan is always a RETURN operator. Figure 16.17. The explain operators
If your application is an OLTP-type application, and the explain plan for one or more of your queries indicates that DB2 is choosing a table scan, you should analyze the EXPLAIN data to determine the reasons why an index scan was not used. If you are administering a data warehouse, the most important thing to look for in the access plans is the type of join used. If you see that you are not using the optimal joins methods, examine the SQL statement and perhaps the partitioning keys and indexes to determine if you can change anything to allow collocation to occur in the joins. |
EAN: 2147483647
Pages: 313