Assessing Your Mac
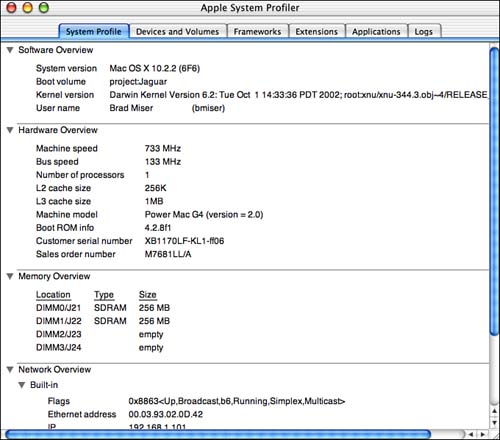
| Key to being able to troubleshoot and solve problems that you can't prevent is to be able to accurately and precisely assess how your Mac is performing and to know the specific configuration of your system. Mac OS X offers many more diagnostic tools than previous versions of the OS; however, several of these tools are quite complicated. Still, even if you might not be able to interpret all of their output, people who are trying to help might be able to, so even in this case it is useful for you to know how to use them. You should understand how to use these tools before you need them. NOTE If you choose Apple menu, About This Mac, you will see a window displaying the version of Mac OS X you are running, the amount of RAM installed in your machine, and the specific processors that it contains. In previous versions of the Mac OS, you could also get information about the RAM allocations for the applications running on your machine, switch among applications, and so on. Because Mac OS X manages RAM for you, this information is no longer valid, so the About This Mac window no longer serves the purposes that it once did. However, for a quick insight into these major system parameters, it is a useful reference. TIP If you click the Mac OS X version number shown in the About This Mac window, you will see the specific build number of the version you are using. Click this information and you will see your Mac's serial number. Using the Apple System Profiler to Create a System ProfileFor quite some time, the Mac OS has included the Apple System Profiler application. This application enables you to get a detailed view into your system at a particular point in time. To create a profile of your system, perform the following steps:
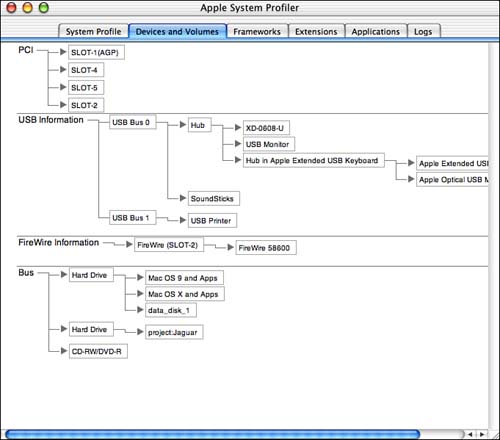
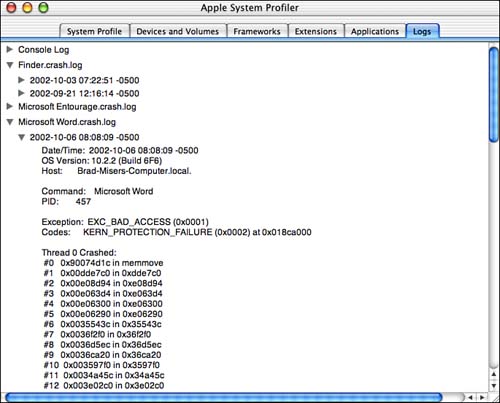
The six tabs shown in the Apple System Profiler window provide the following information:
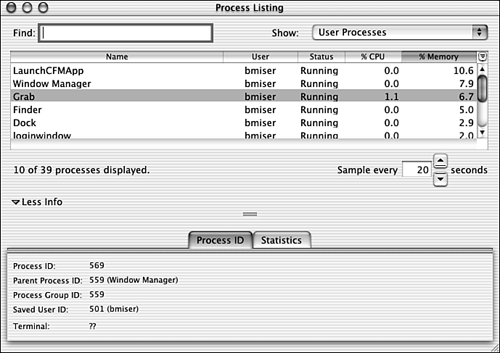
TIP You can copy log information from the Apple System Profiler window and paste it into other applications. For example, if you are getting help, it might be helpful to copy the log information for the problem you are experiencing and e-mail it to the person who is helping you. The Apple System Profiler Commands menu contains some additional commands that might be useful to you. For example, Window, Refresh causes Apple System Profiler to refresh all of its information. Using the Process Viewer to Understand and Manage ProcessesTo provide services, your Mac runs many processes. These processes fall into three categories. User processes are those that are related to your user account, such as running an application. Administrator (also called root) processes are those that are fundamental to the OS and are controlled by the OS, such as the Desktop database. NetBoot processes are those related to network services, such as Apple File Server. The Process Viewer application enables you to get detailed information about any process that is running on your Mac at any point in time. This information can be useful when it comes time to troubleshoot your system. For each process, you can see the user to which it is related, its status, the percentage of CPU activity that it is causing, and the percentage of memory it is using. The following steps walk you through using the Process Viewer:
The following list outlines some additional tasks you can perform in Process Viewer:
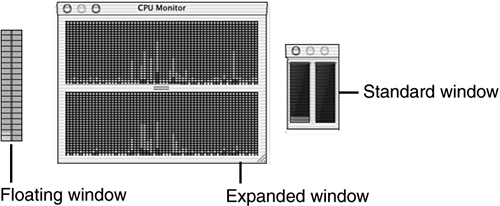
Using the CPU Monitor to Monitor Processor ActivityThe CPU Monitor application provides a graphical representation of the activity in the processors of your Mac (see Figure 28.5). Figure 28.5. The CPU Monitor's windows give you an insight into the level of processor activity at any moment in time; these windows all tell the same story the dual processors in this Mac are mostly idle.
When you launch the application (Applications/Utilities directory), you can use the commands on the Processes menu to choose three different windows in which to see the processor monitoring information. The Standard window shows a wide bar graph for each processor. The Floating window provides a similar view, but without any elements of a typical window. The Expanded window provides you with a view of processor activity over time. In the Expanded window, the different colors of bars represent the different categories of process; for example, by default, user processes are shown in green and root processes are shown in red. You can have all three windows open at the same time or any combination of them. The windows are floating so that they are always on top of the window stack. NOTE Because all three windows float, you might wonder why one of them is called the Floating window. Although I don't know the answer, I think it is because the Floating window is designed to take up less room (for example, it has no borders or title bar) and so is the one you are most likely to leave open all the time. The other windows are larger and because they do "float," you aren't likely to want to use the screen real estate required to leave them open all the time. Use the CPU Monitor's Preferences command to set various aspects of the window's behavior. One of the more useful preferences is the Application Icon Settings. You can choose to display the Standard or Expanded views as icons in the Dock. This keeps the window out of the way, while making it convenient to view CPU activity (see Figure 28.6) . Figure 28.6. Placing the Extended view of the CPU Monitor on the Dock enables you to quickly gain an insight into the processor activity of your Mac.
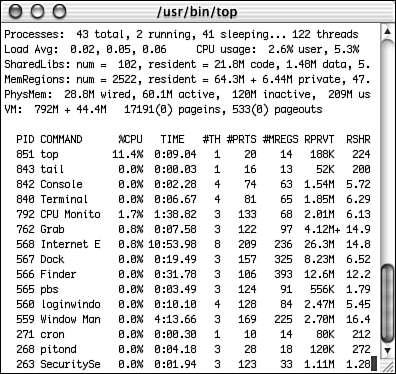
TIP You can open the Process Viewer from within the CPU Monitor by choosing Processes, Open Process Viewer ( Viewing System Activity with TopThe Top window is a Terminal window that provides detailed information about the current operation of your Mac. To access it, open the CPU Monitor and choose Processes, Open Top. TIP You can also open the Top window by typing top in the Terminal window. The Top window provides very detailed information about your system, although not in the most easily understood format (see Figure 28.7). At the top of the Top window, you see a summary of the activity on your machine; the lower part of the window lists all the running processes and detailed information about each. Figure 28.7. Using Top can be a bit intimidating, but the information it provides is worth getting to know.
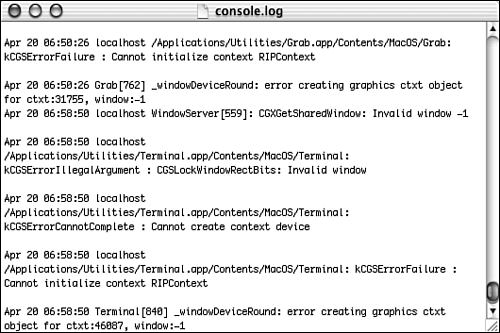
In the summary area of the window, you can see how many processes are running versus the number sleeping, how many threads are running, the average loads, and the percentage of CPU usage of user processes versus system usage. The PhysMem information contains data about your RAM. For example, the amount shown as active is the RAM currently being used by running processes. The VM information provides data about the virtual memory being used. In the lower part of the window, you see a table that provides data on each process that is similar to but more detailed than the information in the Process Viewer. For example, you see the PID, which is the same Process ID as is displayed for a process in the Process Viewer. You can also see the percentage of CPU use, the processor time, and other more technical information. Much of this information will probably not be useful to you unless you are quite technically oriented; however, it can be useful to others when you are trying to get help. You can save the information seen in the Top window by selecting the information in the window and choosing Shell, Save Selected Text As. This text file can be useful to you or to provide to someone else when you are getting help with a problem. Using the Console to View System MessagesThe Console application provides a window to which Mac OS X writes system messages you can view. These messages are mostly error messages; some of these can be useful when you are troubleshooting problems (see Figure 28.8). The messages you see are quite technical; unless you are a programmer or are extremely technically knowledgeable, they probably won't mean much to you. However, Console messages can be helpful when you are communicating a problem to someone else. Figure 28.8. The Console provides system messages that can be of help when you are troubleshooting.
NOTE The Console is cleared when you log out. When you log in again, it begins collecting system messages in a new log. |

EAN: 2147483647
Pages: 260
- ERP Systems Impact on Organizations
- ERP System Acquisition: A Process Model and Results From an Austrian Survey
- The Second Wave ERP Market: An Australian Viewpoint
- A Hybrid Clustering Technique to Improve Patient Data Quality
- Relevance and Micro-Relevance for the Professional as Determinants of IT-Diffusion and IT-Use in Healthcare