Section 9.1. What Do Timing Diagrams Look Like?
9.1. What Do Timing Diagrams Look Like?Timing diagrams will look strangely familiar to anyone with a little experience of the analysis of electronic circuit boards. This is because a timing diagram looks very similar to a plot that you'd expect to see on a logic analyzer. Don't worry if you've never seen a logic analyzer before, though; Figure 9-1 shows a typical display that you would expect to see on one of these devices. Figure 9-1. All of the information on a logic analyzer is also shown on a timing diagram in the form of messages, participants, and states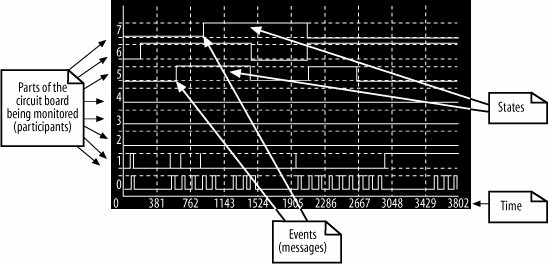 A logic analyzer captures a sequence of events as they occur on an electronic circuit board. A readout from a logic analyzer (such as the one shown in Figure 9-1) will typically show the time at which different parts of the circuit board are in particular states and the electronic signals that will trigger changes in those states. Timing diagrams perform a similar job for the participants within your system. On a timing diagram, events are the logic analyzer's signals, and the states are the states that a participant is placed in when an event is received. The similarities between a timing diagram and a logic analyzer are apparent when you compare Figure 9-1 with Figure 9-2, which gives a sneak preview of how a complete timing diagram looks. This example was taken from UML 2.0 in a Nutshell (O'Reilly). Figure 9-2. Compare this simple yet complete timing diagram for a mail server with the logic analyzer in Figure 9-1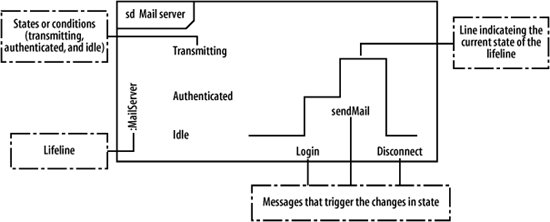 |
EAN: 2147483647
Pages: 175