Figure D-2: System Configuration Utility
Windows XP Professional provides tools and features that you can use to diagnose and troubleshoot startup, applications, and services. Table D-6 is an alphabetical list of tools useful for troubleshooting applications and services. When attempting to identify and resolve problems, follow the guidelines discussed in Troubleshooting Concepts and Strategies in this book.
| Tool | Function | Tool Type, Interface |
|---|---|---|
| Bootcfg (Bootcfg.exe) | Viewing or editing startup settings in the x86-based Boot.ini file or Itanium-based Boot Manager entries. | Built-in, GUI |
| Boot logging | Creating a text-based log (Ntbtlog.txt) of listed drivers that loaded or failed at startup. | Built-in, startup option |
| Dependency Walker (Depends.exe) | Examining a selected application or software component and determining the modules required for it to start. | Support tool, GUI |
| Device Manager | Viewing and changing hardware and device driver settings. | Built-in, GUI |
| DirectX Diagnostic Tool (Dxdiag.exe) | Doing the following:
| Built-in, GUI |
| Dr. Watson (Drwtsn32.exe) | Recording detailed information to a log when application errors occur. | Built-in, GUI configuration |
| Error Reporting | Monitoring your system for problems that affect Windows XP Professional components and applications. When a problem occurs, you can send a report to Microsoft. An automated process searches the error-reporting database for matching conditions and responds with any troubleshooting information found. | Built-in, GUI |
| Event Query (Eventquery.vbs ) | Displaying events and properties from the event logs. | Built-in, command-line |
| Event Triggers (Eventtriggers.exe) | Setting triggers based on event log events. | Built-in, command-line |
| Event Viewer (Eventvwr.msc) | Viewing the Event log, which contains information about application, security, and system events for your computer. | Built-in, GUI |
| Global Flag Editor (Gflags.exe) | Enabling or disabling advanced internal system diagnostics and troubleshooting tests. | Support Tool, GUI |
| Group Policy Snap-in (Gpedit.msc) | Viewing, creating, deleting, or editing user and computer Group Policy object (GPO) settings. | Built-in, GUI |
| Group Policy Results (Gpresult.exe) | Displaying information about the cumulative effect that Group Policy objects have on computers and users. | Built-in, command-line |
| Group Policy Update (Gpupdate.exe) | Refreshing GPOs so that changes takes effect immediately. GPUpdate replaces the Windows 2000 tool Secedit.exe, and provides increased control and flexibility. | Built-in, command-line |
| Kernel Debugger | Analyzing computer memory or a memory dump file written to disk when a Stop message occurs. | Debugging Tool, command-line |
| Memory Pool Monitor (Poolmon.exe) | Detecting and analyzing memory leaks. | Support Tool, GUI |
| OpenFiles (Openfiles.exe) | Listing or closing connections to files and folders opened remotely through a shared folder. | Built-in, command-line |
| Online Crash Analysis | Sending kernel memory dump files to a Web site hosted by Microsoft Corporation for evaluation. An automated process searches a database of known issues for matching conditions. You can optionally receive e-mail updates about your problem. | Web site |
| Performance Monitor (Perfmon.msc) | Obtaining data that is useful for detecting and diagnosing bottlenecks and changes in overall system performance. | Built-in, GUI |
| Process and Thread Status (Pstat.exe) | Viewing the status of threads, processes, and drivers. | Support Tool, command-line |
| Program Compatibility Wizard | Testing and resolving compatibility problems regarding running programs that worked correctly on an earlier version of Windows. | Built-in, GUI |
| Registry Editor (Regedit.exe) | Searching, viewing, and editing the contents of the registry. | Built-in, GUI |
| Resultant Set of Policy (Rsop.msc) | Viewing information about the cumulative effect that Group Policy objects have on computers and users. | Built-in, GUI |
| Runas.exe | Running tools and programs with different permissions than the user s current logon provides. | Built-in, command-line |
| Runas (GUI feature) | Running tools and programs with different permissions than the user s current logon provides. | Built-in, GUI |
| SC (Sc.exe) | Viewing, stopping, starting, pausing, and disabling services, or changing service startup types for diagnostic purposes from the command-line. | Built-in, command line |
| Services snap-in (Services.msc) | Viewing, stopping, starting, pausing, and disabling services, or changing service startup types for diagnostic purposes. | Built-in, GUI |
| Shutdown Event Tracker | Recording information to the System log, describing the reason for shutting down or restarting the computer. | Built-in, GUI |
| System Configuration Utility (Msconfig.exe) | Enabling or disabling various settings for troubleshooting and diagnostic purposes. | Built-in, GUI |
| System Information in Help (Msinfo32.exe) | Collecting and displaying system configuration information about hardware, system components, and software. You can start System Information as a stand-alone tool or by using Windows XP Professional Help and Support Center. | Built-in, GUI |
| System Information (Systeminfo.exe) | Viewing computer configuration information. This is the character-mode version of the GUI-mode System Information tool. | Built-in, command-line |
| Task Killing Utility (TsKill.exe) | Ending one or more active tasks or processes. | Built-in, command-line |
| Task Lister (Tasklist.exe) | Listing active tasks and processes. | Built-in, command-line |
| Task Manager (Taskman.exe) | Viewing and ending active processes running on your system. In addition, you can use Task Manager to view system information, such as CPU and memory usage statistics. | Built-in, GUI |
| Uninstall Windows XP Professional | Uninstalling Windows XP Professional and reverting to the previous operating system. | Built-in, GUI |
In the preceding table, process refers to an instance of an application together with the set of system resources allocated to run the application. Thread refers to an object within a process that is allocated processor time by the operating system to run code. Threads, not processes, run program code. Every process must have at least one thread, which allows a process to maintain parallel lines of execution. This is especially valuable for multiprocessor systems because Windows XP Professional can assign different threads to different processors.
Bootcfg (Bootcfg.exe) is a command-line tool that reduces the potential for error when adding or editing startup settings in the x86-based Boot.ini file or the Itanium-based EFI Boot Manager. You must be logged on as an administrator or a member of the Administrators group to use Bootcfg.
To use Bootcfg to view Boot.ini file settings
To view Boot.ini file or EFI Boot Manager Windows XP Professional startup settings from the command prompt, type bootcfg /query.
For more information about using Bootcfg, click Tools in Help and Support Center.
If your computer stops responding during startup, Boot logging allows you to identify initialized drivers. This information is useful if your computer cannot complete the startup process. By examining the boot log, you can identify the file name of the last file processed, which might be causing the problem. You can then focus your troubleshooting efforts on the suspect file and replace the file or search for an update.
To enable boot logging
Restart the computer.
When prompted, press F8, and then select Enable Boot Logging on the Windows Advanced Options Menu.
Enabling boot logging and restarting causes the operating system to create a log file in the systemroot directory named Ntbtlog.txt. You can view the log by double-clicking it. The log lists files that Windows XP Professional attempted to load during startup. In the log, Loaded driver or Did not load driver precedes the path to each file.
A phrase that appears next to each driver or service that Windows XP Professional successfully loaded. The path and file name of the specific driver or service follow.
A phrase that appears next to a driver or service that Windows XP Professional did not successfully load. The path and file name of the specific driver or service follow.
The following lines are sample Ntbtlog.txt entries:
Loaded driver \SystemRoot\System32\DRIVERS\flpydisk.sys
Did not load driver \SystemRoot\System32\DRIVERS\sflpydisk.sys
Examine the boot log to help identify missing or corrupted files. If a critical system file is corrupted or missing, Windows XP Professional might generate a Stop message or write an entry to the Event logs. To check if a file listed as Did not load driver is corrupted, you can do the following:
Check for zero byte files or files with date and time stamps that do not match the Windows XP Professional installation date.
Compare files in systemroot\System32 to the same files on the Windows XP Professional operating CD or another computer running the same edition (and service pack) of Windows XP Professional.
Run the System File Checker (Sfc.exe) command-line tool to inspect system files. For more information about the System File Checker, see System File Checker later in this appendix.
| Note | In safe mode, new boot log entries are appended to the existing Ntbtlog.txt file. |
Dependency Walker (Depends.exe) is a support tool that enables you to examine a selected application or component to determine what other components are required for the application to start. The tool lists the dependencies in a tree format.
For every component selected, Dependency Walker lists the programming functions of each primary and secondary module. Typically, the system modules have .exe, .dll, .ocx, and .sys file name extensions.
Dependency Walker can also help you identify problems related to missing or corrupt modules, circular dependency errors, and mismatched module types.
For more information about Dependency Walker, click Tools in Help and Support Center, and then click Windows Support Tools. For more information about service dependencies, see Troubleshooting Startup in this book.
Device Manager (Devmgmt.msc) enables you to manage hardware installed on your computer. Use Device Manager to view device settings, to change hardware resource settings to resolve conflicts, and to update, uninstall, or roll back drivers.
For more information about Device Manager, click Tools in Help and Support Center. Or see Managing Devices in this book and Driver Signing and Digital Signatures later in this appendix.
The DirectX Diagnostic Tool (Dxdiag.exe) displays information about DirectX application programming interface (API) components and drivers installed on your system. DirectX is found in Windows 95, Windows 98, Windows Me, Windows 2000, and Windows XP Professional. DirectX allows these operating systems to take advantage of new and current hardware acceleration technologies that new video, audio, and input devices offer.
The DirectX APIs enhance multimedia application performance and enable Windows compatibility with a variety of video, audio, and input hardware. Although multimedia devices, such as audio and video adapters, are physically and functionally similar, they can use different hardware architecture and design philosophies. DirectX technology allows manufacturers to devote more time developing new technologies with less concern about low-level Windows programming details.
The DirectX Diagnostic Tool allows you to view and save information about the following types of hardware:
Audio (DirectMusic and DirectSound )
Video (DirectDraw and Direct3D )
Controller and input devices (DirectInput )
Network hardware (DirectPlay )
Using the DirectX Diagnostic Tool, you can test multimedia driver compatibility and display driver status and version information. If necessary, you can use the tool to disable or reduce hardware acceleration levels to diagnose problems. You can also use the tool to collect information that might be useful during a technical support call.
To start the DirectX Diagnostic Tool
In the Run dialog box, type dxdiag.
The DirectX Diagnostic Tool dialog box reports information on separate tabs about the various components and drivers. Table D-7 describes each tab in the DirectX Diagnostic Tool dialog box.
| Tab | Description |
|---|---|
| System | Provides system information about your computer and specifies the version of DirectX that is installed on your computer. |
| DirectX Files | Lists the file name, version number, date, and size for each DirectX file that is installed on your computer. |
| Display | Lists current display settings and allows you to disable hardware acceleration and test DirectDraw and Direct3D compatibility. |
| Sound | Displays current sound settings and tests audio hardware DirectSound compatibility. |
| Music | Lists music port information, such as Musical Instrument Digital Interface (MIDI) settings, and allows you to test the DirectMusic component of DirectX. |
| Input | Lists the input devices and drivers installed on your computer. |
| Network | Lists the registered DirectPlay service providers that are installed on your computer and allows you to test DirectPlay components. |
| More Help | Offers additional options if you cannot resolve your DirectX issue by using previous tabs. You can start the System Configuration tool (Msconfig.exe) or override DirectDraw video refresh display settings from this tab. For more information about the System Configuration tool, see System Configuration Utility later in this appendix. |
You can use the DirectX Diagnostic Tool to determine whether the following issues apply to your system.
In the Notes section on the DirectX Files, Display, Sound, Music, Input, and Network tabs, look for warnings or files labeled as Beta, Debug, Outdated, or Unsigned drivers. For best performance, install the most recent versions of DirectX and use Microsoft-signed drivers. For more information about obtaining and installing the latest version of DirectX, see the DirectX link on the Web Resources page at http://www.microsoft.com/windows/reskits/webresources
Check the DirectX Files tab for drivers labeled Unsigned or Beta. Unsigned and beta drivers have not been fully tested by Microsoft Corporation for compatibility with the latest version of DirectX.
Some graphics-intensive programs run slowly or not at all if DirectDraw or Direct3D hardware acceleration is unavailable or disabled. Hardware acceleration offloads a substantial portion of 2D image and 3D geometry processing from the central processing unit (CPU) to the video adapter, resulting in much faster system performance. If you experience poor video performance, use the DirectX Diagnostic Tool to verify acceleration settings.
To check video hardware acceleration settings
Start the DirectX Diagnostic Tool.
Select the Display tab, and then in DirectX features verify that at least DirectDraw Acceleration and Direct3D Acceleration are marked as Enabled.
If the option to enable acceleration is not available, your video adapter might not support DirectX acceleration in hardware or you might need to install updated drivers.
| Note | Features such as AGP or Direct3D acceleration might not be available with older video hardware. You might need to upgrade your video hardware to use certain features in newer technologies. |
You can test the following DirectX components:
DirectDraw and Direct3D functionality for video adapters
DirectSound and DirectMusic for audio devices
DirectPlay for network devices
On the Display, Sound, Music, and Network tabs, click a Test button. Record any messages that appears, and then watch or listen to the tests. Each test prompts you to answer Yes or No to verify successful results. The DirectX Diagnostic Tool tests basic features first and progresses to more advanced functions. If you click No, the more advanced tests are cancelled.
If the default DirectX driver settings cause problems, you can reduce or disable acceleration features for video and audio adapters. For more information about disabling or reducing hardware acceleration levels, see Managing Devices in this book.
To save information gathered by the DirectX Diagnostic Tool, click the Save All Information button in the dialog box. You can save information from all DirectX tabs to a user-specified folder and file name.
For more information about DirectX components, architecture, and multimedia in general, see Windows XP Professional Help and Support Center. Also see Managing Devices and Managing Digital Media in this book. For more information about obtaining and installing the latest version of DirectX, see the DirectX link on the Web Resources page at http://www.microsoft.com/windows/reskits/webresources
In the event of an application error, also known as a user-mode program exception, the Dr. Watson tool (Drwtsn32.exe) writes information to a text-based log file named DrWtsn32.log., in systemdrive\Documents and Settings\All Users\Application Data\Microsoft\DrWatson (default folder location). This log contains the following information:
The file name of the program that caused the error.
Information about the computer and user under which the error occurred.
A list of programs and services active when the error occurred.
A list of modules, such as Dynamic Link Library components (DLLs) that were in memory when the error occurred.
Additional information that might be needed if you decide to contact technical support.
The task and module lists are useful for duplicating the conditions under which an application error occurred. Using the lists as a reference, you can add or remove programs and services until you can reproduce the problem.
To view and configure Dr. Watson logs
In the Run dialog box, type drwtsn32.
Problem descriptions appear in Application Errors.
Select an entry, and then click View to display more information about the error.
To configure reporting settings, select items in the Options area.
To view logs directly from the Start menu
In the Run dialog box, type:
notepad %systemdrive%\documents and settings\all users\documents\drwatson\drwtsn32.log
For more information about the Dr. Watson tool (including a log file overview), click Tools in Help and Support Center.
Windows XP Professional provides the Error Reporting service, which monitors your system for user-mode and kernel-mode faults that affect the operating system and applications. When an error occurs, the Error Reporting service gathers information about your problem and gives you the option to use an automated system to find more information and possibly a resolution.
When a user mode error occurs, such as an application error, the Error Reporting service takes the following steps:
Displays an alert stating that Windows XP Professional detected a problem. You can click Report this Problem or Don t Report; or you can click click here for technical information before sending a report to Microsoft.
Sends a problem report to Microsoft. If you click Report this Problem, the Error Reporting service sends the error report anonymously to Microsoft by using a Secure Sockets Layer (SSL) encryption secured Internet connection. You might be prompted to provide additional information to complete your error report. When the process is complete, you can click More Information, which directs you to updated drivers, patches, or Microsoft Knowledge Base articles.
To verify that Windows Error Reporting is enabled for programs
In Control Panel, open System.
Click the Advanced tab, and then click Error Reporting.
In the Error Reporting dialog box, select Enable error reporting, and if not checked, click to enable the Programs check box.
When a Stop error occurs, Windows XP Professional displays a Stop message and writes diagnostic information to a memory dump file. When you restart your system by using normal mode or safe mode (with networking) and log on to Windows XP Professional, the Error Reporting service gathers information about the problem and displays a dialog box that gives you the option of sending a report to Microsoft.
For more information about Error Reporting, click Tools in Help and Support Center. For more information about Stop Messages, memory dump files, and using Error Reporting to get information about kernel-mode errors, see Common Stop Messages for Troubleshooting in this book.
Event Query (Eventquery.vbs) is a command-line tool that you can use to search the event logs by using specified criteria. For troubleshooting, using Event Query enables you to view the event logs for entries related to specified event properties, including date and time, event ID, and user name.
Event Query also enables you to save output to a file and to specify the file format to use. For example, you can save output to a .csv file and further analyze the data by using Microsoft Excel.
For more information about Event Query and the event logs, click Tools in Help and Support Center.
Event Triggers (Eventtriggers.exe) is a command-line tool that you can use to view, set, or delete trigger events. You can specify an error-log trigger condition to monitor and the task to run, including starting other programs, if thresholds are exceeded. For example, you can create a trigger that starts Disk Cleanup (Cleanmgr.exe) when a Low Disk Space message is recorded to the System log.
For more information about Event Triggers and the event logs, click Tools in Help and Support Center.
Event Viewer (Eventvwr.msc) maintains application, security, and system logs for your computer. It also contains useful information for diagnosing hardware and software problems. Event Viewer provides three logs.
Contains events logged by applications or programs. For example, a database program might record read or write errors to this log.
Holds security event records, such as logon attempts and actions related to creating, opening, or deleting files. An administrator can view information or specify events to record in the security log.
Contains information about system components. For example, an entry is made when a driver or other system component fails to load during startup. For more information about how to insert custom shutdown information into the System log, see Shutdown Event Tracker later in this appendix.
You can save Event Viewer logs and specify filtering criteria for viewing information. Event Viewer logs can provide clues to problems that affect the system. When troubleshooting, use the information to identify problems with applications, drivers, or services, and to identify frequently occurring issues.
To start Event Viewer
In the Run dialog box, type eventvwr.msc.
or
Start Event Viewer from the Computer Management snap-in.
For more information about the Computer Management MMC snap-in, see Computer Management Tool later in this appendix. For more information about using Event Viewer, see Help on the Action menu in Event Viewer.
Global Flags Editor (Gflags.exe) is a GUI-mode Support Tool that allows members of the Administrators group to enable and disable advanced internal system diagnostics and troubleshooting features on computers running Windows XP Professional. Gflags.exe is designed as a debugging tool for application developers. It is most often used to turn on indicators that other tools track, count, and log.
Use it to edit the global flag settings that the kernel uses when starting. The term global flag refers to the GlobalFlag registry entries that Windows XP Professional checks to enable or disable advanced internal system diagnostics and troubleshooting tests.
| Caution | Incorrect use of Global Flags Editor might cause system startup failure or adversely impact performance. Use this tool only as directed by Microsoft Product Support Services. |
For more information about Global Flags Editor, click Tools in Help and Support Center, and then click Windows Support Tools. For more information about memory leaks, see Debugging Tools Help and Evaluating Memory and Cache Usage in the Operations Guide of the Microsoft Windows 2000 Server Resource Kit.
The Group Policy snap-in (Gpedit.msc) allows you to view, create, delete, or edit user and computer Group Policy objects (GPOs). The Group Policy snap-in enables you to view which Group Policy settings are in effect and simplify troubleshooting by disabling GPOs that can affect the way your system starts and performs. You must be logged on as an administrator or a member of the Administrators group to use the Group Policy snap-in.
To start the Group Policy snap-in
In the Run dialog box, type gpedit.msc.
For an illustration of using the Group Policy snap-in to help diagnose a startup problem, see Troubleshooting Startup in this book. Also, see article Q256320, Startup Scripts May Appear to Hang Windows 2000, in the Microsoft Knowledge Base. To find this article, see the Microsoft Knowledge Base link on the Web Resources page at http://www.microsoft.com/windows/reskits/webresources
Two related tools, Group Policy Results (Gpresult.exe) and the Resultant Set of Policy snap-in (Rsop.msc) enable you to view Group Policy settings. Another related tool, Group Policy Update (Gpupdate.exe) enables you to immediately refresh changes to GPOs. For more information about using the Group Policy snap-in, see Windows XP Professional Help and Support Center.
For more information about Group Policy, see Authorization and Access Control, Planning Deployments, and Managing Desktops in this book. Also, see the Distributed Systems Guide of the Microsoft Windows 2000 Server Resource Kit and the Change and Configuration Management Deployment Guide link on the Web Resources page at http://www.microsoft.com/windows/reskits/webresources
Group Policy Results (Gpresult.exe) is a command-line tool that displays information about the cumulative result that Group Policy objects (GPOs) have on computers and users. Use this tool to view which Group Policy settings are in effect for the local computer, sites, domains, and organizational units (OUs). Group Policy Results provides information that can help you identify and troubleshoot problems due to missing or improperly applied GPOs.
Two related tools, the Group Policy snap-in (Gpedit.msc) and the Resultant Set of Policy snap-in (Rsop.msc) enable you to change and view Group Policy information. For more information about using Gpresult.exe, see Windows XP Professional Help and Support Center.
For more information about Group Policy, see Authorization and Access Control, Planning Deployments, and Managing Desktops in this book. Also, see the Distributed Systems Guide of the Microsoft Windows 2000 Server Resource Kit and the Change and Configuration Management Deployment Guide link on the Web Resources page at http://www.microsoft.com/windows/reskits/webresources
Group Policy changes do not always take effect immediately. You can use the Group Policy Update (Gpupdate.exe) command-line tool to immediately refresh changes to user and computer GPOs. Group Policy Update replaces the secedit /refreshpolicy command used in Windows 2000 to refresh Group Policy settings. You must be logged on as an administrator or a member of the Administrators group to run Gpupdate.exe.
After you run Gpupdate.exe, you can use the Resultant Set of Policy snap-in (Rsop.msc) or the Group Policy Results (Gpresult.exe) tool to verify that the updated settings are in effect. For more information about using Gpupdate.exe, see Windows XP Professional Help and Support Center.
For more information about Group Policy, see Authorization and Access Control, Planning Deployments, and Managing Desktops in this book. Also, see the Distributed Systems Guide of the Microsoft Windows 2000 Server Resource Kit and the Change and Configuration Management Deployment Guide link on the Web Resources page at http://www.microsoft.com/windows/reskits/webresources
You can use a kernel debugger for real-time computer debugging, or to analyze a memory-dump file saved to disk when a Stop error occurs. A kernel debugger enables advanced users to view the contents of computer memory, including source code and variables. The following are two debuggers that you can obtain from Microsoft.
Kernel Debugger (Kd.exe) is a command-line debugging tool that you can use to analyze a memory dump file written to disk when a Stop message occurs. Kernel Debugger requires that you install symbol files on your system.
WinDbg Debugger (Windbg.exe) provides functionality similar to Kernel Debugger, but uses a GUI interface.
Kernel Debugger and WinDbg Debugger are two of many available debugging tools. For more information about kernel debugging tools, Stop messages, memory-dump files, or symbol files, see Debugging Tools Help or Common Stop Messages for Troubleshooting in this book.
Memory Pool Monitor (Poolmon.exe) is a Support Tool used to detect memory leaks.
For more information about the Pool Monitor and a related tool, Global Flags Editor (Gflags.exe), click Tools in Help and Support Center, and then click Windows Support Tools. Also, see Debugging Tools Help. For more information about memory leaks, see Evaluating Memory and Cache Usage in the Operations Guide of the Microsoft Windows 2000 Server Resource Kit. Also, see Global Flags Editor earlier in this appendix.
The Online Crash Analysis Web site enables you to send kernel-mode error reports to Microsoft Corporation and track the status of reports previously sent by using your Microsoft Passport information. You can access the Online Crash Analysis Web site by using the Error Reporting service or by using your Web browser. For more information about using the Online Crash Analysis Web site and the Error Reporting service to diagnose Stop errors, see Common Stop Messages for Troubleshooting in this book.
OpenFiles (Openfiles.exe) is command-line tool that you can use to view or disconnect connections to files and folders opened remotely by using a shared folder.
For more information about using OpenFiles, click Tools in Help and Support Center.
The Performance (Perfmon.msc) MMC snap-in enables you to establish performance baselines, diagnose system problems, and anticipate increased system resource demands. This tool can be used to obtain useful data for detecting system bottlenecks and changes in system performance.
The Performance snap-in has two components:
System Monitor
Performance Logs and Alerts
These components allow you to collect, save, and view real-time data pertaining to memory, disk, processor, network, and other activities in various formats such as graphs, histograms, and reports. You can configure Performance Logs and Alerts to record performance data and set system alerts when a specified parameter is above or below a defined threshold.
To start the Performance snap-in
In the Run dialog box, type perfmon.msc.
For more information about the Performance Tool, see Windows XP Professional Help and Support Center and Overview of Performance Monitoring in the Operations Guide of the Microsoft Windows 2000 Server Resource Kit.
Process and Thread Status (Pstat.exe) is a command-line Support Tool that enables you to view the status of threads, processes, and drivers running on your computer.
For an illustration of how to use Process and Thread Status to identify driver problems, see article Q192463, Gathering Blue Screen Information After Memory Dump, in the Microsoft Knowledge Base. To find this article, see the Microsoft Knowledge Base link on the Web Resources page at http://www.microsoft.com/windows/reskits/webresources
For more information about Process and Thread Status, click Tools in Help and Support Center, and then click Windows Support Tools.
The Program Compatibility Wizard allows you to test and resolve compatibility issues with a program that worked correctly on an earlier version of Windows. By using the Program Compatibility Wizard, you might be able to run an older program by using a specific compatibility mode and display resolution.
You can run a program released for an earlier version of Windows by using the following compatibility modes:
Windows 95
Windows 98 and Windows Me
Windows NT 4.0 (Service Pack 5)
Windows 2000
You can also use the following display options to resolve video driver compatibility problems:
Run in 256 colors
Run in 640 x 480 screen resolution
Disable visual themes
To set compatibility mode options for a program (Method 1)
From the Start menu, click Accessories, and then click Program Compatibility Wizard.
Follow the on-screen instructions to select a program, and to specify the compatibility options to use when running the program.
To set compatibility mode options for a program (Method 2)
Open Windows Explorer to locate the program.
Right-click the program s icon, and then click Properties.
In the Properties dialog box, click the Compatibility tab.
Select the options you want to use, and then click OK.
| Warning | It is recommended that you do not run virus detection software, backup programs, CD authoring tools, or other programs that install system drivers and services, while in compatibility mode. |
Always consult the software manufacturer s Web site for more information about obtaining Windows XP Professional specific updates. For more information about program compatibility, see Windows XP Professional Help and Support Center.
Advanced users can use the registry editor, Regedit.exe, to view or change system settings. The registry is a central database that stores information about users, software, and hardware. The registry editor displays the data by using a GUI that lists subtrees, keys, subkeys, and entries. Subkeys are similar to folders and can hold entries and other subkeys. Valid data types for entries include strings, dwords (hexadecimal values), and binary values.
Editing the registry directly is seldom required, and using the registry editor is typically a last-resort option. Use caution when editing the registry, because specifying incorrect values can cause instability. The registry editor is intended for advanced users who are familiar with registry concepts and want to configure settings for which a user interface does not exist. If you must edit the registry, back it up first and see the Registry Reference in the Microsoft Windows 2000 Server Resource Kit at http://www.microsoft.com/reskit
Before you use the registry editor, be sure that you can restore your system if problems occur. Before changing registry values, use System Restore or the Backup tool. For more information about System Restore, see System Restore earlier in this appendix. For more information about using the Backup tool for troubleshooting, see Backup earlier in this appendix. Also, see Backup and Restore in this book.
If you have not saved the system state and encounter problems, you might be able to recover by restarting the computer and using the Last Known Good Configuration startup option. For more information about using this option, see Last Known Good Configuration earlier in this appendix.
The registry editor, Regedit.exe, in Windows XP Professional provides many improvements and convenient features that enable you to do the following:
Make all your changes by using one registry editor, Regedit.exe. Regedit.exe in Windows XP Professional combines the features of the two registry editors in Windows 2000 (Regedit.exe and Regedt32.exe) into a single program. Regedit.exe in Windows XP Professional supports importing portions of the registry that were backed up by using versions of Regedit32.exe included with Windows NT 4.0 and Windows 2000.
Perform searches by using criteria that you specify. Performance improvements enable you to view search results more quickly than previous versions.
Save commonly used or hard-to-find subkeys and entries in a list of favorites for faster access in the future.
Quickly return to a location in the registry, because the registry editor records and opens the last location that you viewed.
Export all or a portion of registry content to a file that can be read by using a text editor such as Notepad. Information contained in these exported files is logically organized and labeled.
Use the registry editor from the command line by specifying the /s parameter. When you use /s, Regedit.exe does not display a GUI or pause for user confirmation. This enables you to use the registry editor in batch files.
The registry consists of five subtrees that group computer information and settings by category or scope. Table D-8 lists and describes the five subtrees that make up the registry.
| Subtree | Description |
|---|---|
| HKEY_CLASSES_ROOT | Stores the information that maintains file associations to ensure that the correct program runs when you open a data file. For example, the information in this subkey associates files using a .doc file name extension with Microsoft Word if Microsoft Office is installed. This subtree also contains information necessary to support core aspects of the Windows user interface, such as drag-and-drop operations. |
| HKEY_CURRENT_USER | Contains configuration settings for the user currently logged on. Examples of information stored for each user are Desktop wallpaper and custom color settings. User-specific information in HKEY_CURRENT_USER is taken from the HKEY_USERS subtree during the logon process. |
| HKEY_LOCAL_MACHINE | Contains computer-specific hardware and software settings that apply to the entire computer, regardless of the user logged on. An example of this is hard disk configuration settings. |
| HKEY_USERS | Contains information that applies to all users of the computer. Settings that apply to all users, as well as user-specific settings, are stored in this subtree. User-specific information is grouped by security identifier (SID) values, a unique number assigned to a user account. |
| HKEY_CURRENT_CONFIG | Contains information about the current hardware profile used by the local computer. HKEY_CURRENT_CONFIG is an alias for information stored in HKEY_LOCAL_MACHINE. |
For more information about using the registry editor, Regedit.exe, click Tools in Help and Support Center.
The Resultant Set of Policy (RSoP) snap-in (Rsop.msc) enables you to poll and evaluate the cumulative effect that local, site, domain, and organizational unit Group Policy objects (GPOs) have on computers and users. Resultant Set of Policy enables you to check for GPOs that might affect your troubleshooting. For example, a GPO setting can cause startup programs to run after you log on to the computer.
Use this snap-in to evaluate the effects of existing GPOs on your computer. This information is helpful for diagnosing deployment or security problems. Rsop.msc reports individual Group Policy settings specific to one or more users and computers, including advertised and assigned applications.
To start the Resultant Set of Policy snap-in
In the Run dialog box, type rsop.msc.
For more information about Group Policy, see Authorization and Access Control, Planning Deployments, and Managing Desktops in this book. Also, see the Distributed Systems Guide of the Microsoft Windows 2000 Server Resource Kit and the Change and Configuration Management Deployment Guide link on the Web Resources page at http://www.microsoft.com/windows/reskits/webresources
Two related tools, the Group Policy snap-in (Gpedit.msc) and the Group Policy Results tool (Gpresult.exe) allow you to view Group Policy information. For more information about the preceding tools, see Group Policy Snap-in and Group Policy Results earlier in this appendix.
RunAs (Runas.exe) is a command-line tool that you can use to run tools and programs with different permissions than the user s current logon provides. For troubleshooting, this enables you to run configuration and diagnostic tools with administrator credentials while logged on as another user (for example, a user account that is a member of the Power Users group). You can then test and observe the results that these changes have on user accounts and groups that do not have administrative privileges.
For more information about using the RunAs command-line tool, see Windows XP Professional Help and Support Center.
Windows XP Professional enables you to run tools and programs from the Start menu, Windows desktop, and Windows Explorer, with different permissions than the user s current logon provides. For troubleshooting, this enables you to run configuration and diagnostic tools with administrator credentials while logged on as another user (for example, a user account that is a member of the Power Users group). You can then test and observe the results that these changes have on user accounts and groups that do not have administrative privileges.
To start a program as an administrator
Locate an executable file, snap-in, or shortcut to run by using the Start menu, Windows desktop, or Windows Explorer.
Press and hold the SHIFT key, right-click the program icon, and then click Run as.
In the Run As dialog box, specify a user account with administrative permissions, and then click OK.
For more information about using RunAs functionality from the Windows GUI, see Use the runas command to start programs as an administrator in Windows XP Professional Help and Support Center.
SC (Sc.exe) is a command-line tool that communicates with the Windows XP Professional Services Control Manager (SCM) and displays information about processes running on your computer. SC enables you to perform many functions including:
Display service information such as startup type and whether you can pause or end a process.
Start, pause, resume, or end a process.
The following illustrates output obtained by typing sc query at the command prompt:
SERVICE_NAME: winmgmt
DISPLAY_NAME: Windows Management Instrumentation
        TYPE               : 20 WIN32_SHARE_PROCESS
        STATE              : 4 RUNNING
                                (STOPPABLE,PAUSABLE,ACCEPTS_SHUTDOWN)
        WIN32_EXIT_CODE    : 0 (0x0)
        SERVICE_EXIT_CODE : 0 (0x0)
        CHECKPOINT         : 0x0
        WAIT_HINT          : 0x0
SC enables you to create lists of components that are running in safe and normal modes. By comparing the differences between the two lists, you can determine which components are not required to start Windows XP Professional. For diagnostic purposes, you can disable services individually in safe mode and then try to start your computer in normal mode.
For more information about SC, click Tools in Help and Support Center. For more information about troubleshooting startup problems, see Troubleshooting Startup in this book.
The Services (Services.msc) snap-in enables you to view service information or to temporarily stop, pause, or disable services for troubleshooting or diagnostic purposes. You must be logged on as an administrator or a member of the Administrators group to change service properties.
To start the Services snap-in
In the Run dialog box, type services.msc.
or
Start the Services snap-in from the Computer Management tool.
For more information about the Computer Management tool, click Tools in Help and Support Center. Also, see Computer Management Tool later in this appendix.
To view properties for a service, double-click the service name. For more information about services and using the Services snap-in to troubleshoot application and startup problems, click Tools in Help and Support Center and see Troubleshooting Startup in this book.
Shutdown Event Tracker provides a mechanism to record reasons in the System log for scheduled (planned), unscheduled (unplanned), and unexpected computer shutdowns or restarts. This mechanism takes the form of a Shutdown Event Tracker dialog box that appears if any of the following events occur:
Immediately after a user clicks Shut Down from the Start menu, and then clicks Shut Down or Restart from the Shut Down Windows dialog box.
After a user resets the computer and logs on to Windows XP Professional.
After power is disconnected, when a user starts the computer and logs on to Windows XP Professional.
You can indicate whether the shutdown or restart was planned or unplanned. The reasons and comments that you provide are recorded to the System log. Predefined reasons that Windows XP Professional provides for planned and unplanned shutdowns include the following:
Hardware: Maintenance (Planned and Unplanned)
Hardware: Installation (Planned and Unplanned)
Operating System: Upgrade (Planned and Unplanned)
Operating System: Configuration Change (Planned and Unplanned)
Application: Maintenance (Planned and Unplanned)
Application: Unresponsive (Planned and Unplanned)
Application: Unstable (Unplanned)
A shutdown that is not initiated by the operating system, an application, a service, or the Shut Down Windows dialog box is an unexpected shutdown. Causes of unexpected shutdown include a power failure or a disconnected power cable. Predefined reasons for unexpected shutdowns include the following:
System Failure: Stop error
Power Failure: Cord Unplugged
Power Failure: Environment
Other Failure: System Unresponsive
Unknown
| Caution | Do not edit the registry unless you have no alternative. The registry editor bypasses standard safeguards, allowing settings that can damage your system, or even require you to reinstall Windows. If you must edit the registry, back it up first and see the Registry Reference in the Microsoft Windows 2000 Server Resource Kit at http://www.microsoft.com/reskit |
By default, Shutdown Event Tracker is disabled for Windows XP Professional. Use the following procedure to enable or disable Shutdown Event Tracker.
To enable or disable Shutdown Event Tracker
In the Run dialog box, start the registry editor by typing regedit.exe, and then clicking OK.
In the registry editor, navigate to HKEY_LOCAL_MACHINE\SOFTWARE\ Microsoft\Windows\CurrentVersion\Reliability, and then double-click ShutdownReasonUI.
To enable Shutdown Event Tracker, assign a value of 1.
or
To disable Shutdown Event Tracker, assign a value of 0.
Click OK, and then close the registry editor.
Use the following procedure to view Shutdown Event Tracker information.
To view Shutdown Event Tracker information
In the Run dialog box, type eventvwr.msc.
In Event Viewer (local), click System Log.
On the View menu, click Find to open the Find in local System dialog box.
In the Event ID box, type 1074 (planned and unplanned) or 1076 (unexpected shutdown), and then click Find Next.
Click the up or down arrows to view each matching entry. Shutdown or restart information appears in the Description box.
A related command-line tool, Shutdown (Shutdown.exe) enables you to shut down the computer from the command line. By using the -d parameter, Shutdown also enables you to record shutdown reasons to the System log. Another related tool, Event Query (Eventquery.vbs) enables you to search the System log on one or more computers for shutdown information, and save the output to a file for further evaluation. For more information about Shutdown Event Tracker and the Shutdown command-line tool, click Tools in Help and Support Center.
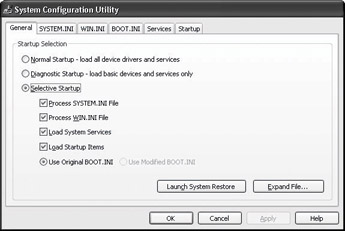
System Configuration Utility (Msconfig.exe) allows you to temporarily change the way Windows XP Professional starts by disabling startup programs and services individually or several at a time. For example, on x86-based computers, you can use this tool to disable 16-bit startup applications specified in Win.ini and System.ini. Figure D-2 shows the tabs available and the options on the General tab. You must be logged on as an administrator or a member of the Administrators group to change or restore settings by using System Configuration Utility.
Figure D-2: System Configuration Utility
To change options by using System Configuration Utility
In the Run dialog box, type msconfig.
In the System Configuration Utility dialog box, click one of the tabs, and then enable or disable the available options by clearing or selecting the check box for a configuration option.
System Configuration Utility provides several configuration tabs that allow you to enable or disable system services and startup applications.
Allows you to start Windows XP Professional in Normal, Diagnostic, or Selective Startup mode.
Starts Windows XP Professional in safe mode with only basic device drivers and services active. When you select the Diagnostic Startup option, System Configuration Utility disables most services, and you might not be able to run certain Computer Management and Control Panel tools. To use these tools, select the Selective Startup option on the General tab, and then enable the following services listed on the Services tab:
Cryptographic Services
Event Log
Logical Disk Manager
Help and Support
Plug and Play
Remote Procedure Call (RPC)
System Restore Service
Windows Management Instrumentation
For more information about the Computer Management tool, see Computer Management Tool later in this appendix.
Allows you to enable or disable programs and services listed in the SYSTEM.INI, WIN.INI, BOOT.INI, Startup, and Services tabs. Disabling a check box under Selective Startup disables all entries in the corresponding tab. You can also enable or disable individual entries on each tab.
On these two tabs, you can enable or disable services and startup programs meant for earlier versions of Windows. Both the systemroot\System.ini and systemroot\Win.ini files are not required by Windows XP Professional and these files are maintained only for compatibility with older software that does not use the registry to save settings. The System.ini file is used to start and store information for drivers and services; the Win.ini file plays a similar role for applications.
On this tab you can customize your Boot.ini file. For more information about the Boot.ini file, see Troubleshooting Startup in this book.
On this tab you can enable or disable specific services. Enabling Hide All Microsoft Services allows you to isolate and disable third-party services.
Certain applications (such as antivirus programs) run as services. Problems with these applications might prevent you from starting Windows XP Professional in normal mode. You can use System Configuration Utility to disable a service and verify that it is the cause of the problem. For more information about troubleshooting startup problems, see Troubleshooting Startup in this book.
You can enable or disable startup programs on this tab. For more information about disabling startup programs, see Troubleshooting Startup in this book.
If you change any startup setting by using System Configuration Utility, the following message appears the next time you log on to the system:
You have used the System Configuration Utility to change the way Windows starts.
The System Configuration Utility is currently in Diagnostic or Selective Startup
mode, causing this message to be displayed and the utility to run every time Windows starts. Choose the Normal Startup mode on the General tab to start Windows normally an d undo the changes you made using the System Configuration Utility.
Simplifying system configuration is an essential part of troubleshooting. For more information about using System Configuration Utility, click Tools in Help and Support Center.
Systeminfo (Systeminfo.exe) is a command-line tool that displays computer configuration information. You can use this tool to gather information useful for troubleshooting, such as the firmware version and any hotfixes applied. This tool is separate from the GUI-based System Information tool (Msinfo32.exe) but provides similar information.
To start Systeminfo, type systeminfo at the command prompt.
The following is an illustration of Systeminfo output:
Host Name:                 RLY-1-TST
BIOS Version:              BIOS v4.51PG
Boot Device:               \Device\HarddiskVolume1
Total Physical Memory:     127.00 M
Available Physical Memory: 8,976.00 K
Virtual Memory: Max Size: 443,176.00 K
Virtual Memory: Available: 190,580.00 K
Virtual Memory: In Use:    252,596.00 K
Domain:                    mydomain.com
Logon Server:              \\LOGON-SRV-1
Hotfix(s):                 1 Hotfix(s) Installed.
For more information about Systeminfo.exe, click Tools in Help and Support Center.
System Information (Msinfo32.exe) displays configuration information that can help you diagnose and troubleshoot problems.
To start System Information
In the Run dialog box, type msinfo32.
System Information displays and groups information about your computer into categories.
System Summary displays information about the system, such as processor type, computer name, and the amount of physical memory available. System Summary is a good starting point to search for information about the environment in which the problem is occurring.
This item displays information such as direct memory access (DMA) channels, free and used interrupt request (IRQ) lines, device conflicts, and resource sharing. Hardware Resources contains a Problem Devices item, which lists descriptions and error codes for devices that might not be functioning correctly. Expand Hardware Resources to obtain information about system hardware resource settings. Table D-9 describes the information displayed.
| Resource | Description |
|---|---|
| Conflicts/Sharing | Provides information about shared or conflicting devices, including several bus types such as Industry Standard Architecture (ISA), Peripheral Component Interconnect (PCI), Small Computer System Interface (SCSI), and PC Card or Personal Computer Memory Card International Association (PCMCIA). Shared resources are not necessarily in conflict. For example, PCI devices can share IRQs. |
| DMA | Reports the DMA channels in use, the devices that use them, and the channels that are free for use. |
| Forced Hardware | Lists devices that have manually specified resources, instead of resources that Windows XP Professional assigns. This information is useful for troubleshooting Plug and Play resource conflicts. |
| I/O | Lists all input and output (I/O) port ranges in use and the devices that use each range. |
| IRQ | Summarizes IRQ usage by identifying the devices that use each IRQ; also identifies which IRQs are free. |
| Memory | Lists memory address ranges in use by devices. |
For more information about system resources and managing device settings, see Managing Devices in this book.
This item displays hardware information for installed devices such as ports, display, and USB. Components contains a Conflicts/Shared item, which lists descriptions and error codes for devices that might not be functioning correctly. Expand Components for information about device component configuration. For information about devices that have assigned error codes from Windows XP Professional, check Problem Devices when you are troubleshooting.
For more information about system resources and how to manage device settings, see Managing Devices in this book.
Software Environment displays a list of drivers, environment variables, tasks, and services. You can use this information to verify that a process is running or to determine versions. Expand Software Environment for information about software in system memory. Table D-10 describes the information displayed.
| Category | Description |
|---|---|
| System Drivers | Lists and displays status for all enabled drivers. |
| Signed Drivers | Provides the same type of information as System Drivers but limits the scope to signed drivers. |
| Environment Variables | Lists all system environment variables and their values. |
| Print Jobs | Lists open print jobs. |
| Network Connections | Lists all mapped network connections. |
| Running Tasks | Lists all processes currently running on the system. |
| Loaded Modules | Lists loaded system-level DLLs and programs, along with their version numbers, size, and file date and path. Useful for debugging software problems, such as application faults. |
| Services | Lists all available system services, showing current run status and start mode. |
| Program Groups | Lists all existing program groups for all known users of the system. |
| Startup Programs | Lists programs started automatically either from the registry, the Startup program group or the Win.ini file. |
| OLE Registration | Lists OLE file associations controlled by the registry. |
This item displays a list of configuration settings related to Internet Explorer. Expand Internet Explorer to obtain information about system configuration. Table D-11 describes the information displayed.
| Category | Definition |
|---|---|
| Summary | Lists Internet Explorer information, such as the version and cipher strength. |
| File Versions | Lists all files associated with Internet Explorer, as well as version numbers, file sizes, file dates, installation paths, and manufacturer. |
| Connectivity | Lists all the connectivity settings used by Internet Explorer. |
| Cache | Lists a general summary of cache settings and of cached objects. |
| Content | Determines if Content Advisor is enabled and lists all installed personal certificates, other people certificates, and publishers. |
| Security | Lists the settings for Internet security zones. |
The Tools menu in System Information provides convenient access to several troubleshooting tools and features including the following:
Backup
Disk Cleanup
Dr. Watson
DirectX Diagnostic Tool
File Signature Verification Tool
Hardware Wizard
Network Connections
System Monitor
To save System Information data to a text file
Start System Information.
On the File menu, click Export, and then type a file name.
To print the information, under the File menu, click Print.
A full System Information printout is an important record of your computer s baseline configuration that you can use for troubleshooting. For more information about system baselines, see Troubleshooting Concepts and Strategies in this book.
Task Kill (Tskill.exe) is a command-line tool used to end one or more processes. You can end processes by using a command-line parameter to Tskill.exe that specifies the process identifier (PID) or any part of the process name, such as the title of the application s main window. You can obtain a list of process names and IDs by using a related tool, Task List (Tasklist.exe).
Use Task Kill for troubleshooting when you suspect that faulty services or applications that stop responding or consume excessive system resources might be adversely affecting the performance of your system. Symptoms typically include sluggish performance, slow screen updates, delayed response to network requests, or slow response to keyboard and mouse input.
You can use Task Kill to specify how to stop processes, such as by:
Sending the process a command to halt itself.
Forcing the process to end.
Task Kill is useful for terminating tasks when Task Manager is not available or when you are remotely connecting to other computers by using the Telnet protocol.
For more information about Task Kill or the related Task List tool, click Tools in Help and Support Center. For more information about using task listing or task ending tools for troubleshooting, see Troubleshooting Startup in this book.
The Task List command-line tool (Tasklist.exe) allows you to obtain a list of active processes that are running on a local computer. For each process, Task List displays the process name and process identifier (PID). The following is output from Task List:
Host Name        Image Name                   PID Session   Mem Usage
================ ========================= ====== ======== ============
RLY-TST-WXP      System Idle Process            0        0         20 K
RLY-TST-WXP      System                         4        0        216 K
RLY-TST-WXP      smss.exe                     188        0        332 K
RLY-TST-WXP      csrss.exe                    200        0      2,996 K
You can terminate a process by specifying the PID number as a command-line parameter to process-ending tools such as Task Kill or Process Viewer. You can disable a process to rule it out as the cause of a problem. For more information about troubleshooting applications and services, see Troubleshooting Startup in this book.
For more information about the Task List or the related Task Kill and Process Viewer tools, click Tools in Help and Support Center.
Task Manager (Taskmgr.exe) is a GUI tool that enables you to view or end a processes or an unresponsive application. You can also use Task Manager to gather other information, such as CPU statistics.
To start Task Manager
At the command prompt, type taskmgr.
or
You can start Task Manager by pressing CTRL+ALT+DEL and then clicking Task Manager.
The Task Manager window contains four tabs: Applications, Processes, Performance, and Networking. The Applications and Processes tabs provide a list of applications or processes currently active on your system. These lists are valuable, because active tasks do not always display a user interface, making it difficult to detect activity. Task Manager displays active processes and enables you to end most items by clicking End Process. You cannot end some processes immediately, and you might need to use other programs such as the Services snap-in, Task Kill, Process Viewer, or equivalent tools, to end them. You can also customize Task Manager to increase or decrease the level of detail shown on the Processes tab.
To display additional information on the Processes tab
Start Task Manager, and then click the Processes tab.
On the View menu, click Select Columns.
Select or clear the columns that you want to add to, or remove from, the Processes tab.
For more information about using Task Manager, start the tool, and then on the Help menu, click Task Manager Help Topics.
For systems upgraded to Windows XP Professional from Windows 98 or Windows Me, you might be able to revert to the previous operating system as a method for resolving the following problem.
After upgrading to Windows XP Professional, you might discover that a critical application does not run or a device fails to initialize. Consult the software or hardware manufacturer to determine if a compatibility problem exists. You might also learn that one of the following conditions applies to you:
The program does not run correctly, even after running the Program Compatibility Wizard. For more information, see Program Compatibility Wizard earlier in this appendix.
The manufacturer no longer supports the application or device and an update is not available. Furthermore, device drivers for earlier versions of Windows do not work.
The manufacturer supports the device, but a Windows XP Professional update is not yet available. Furthermore, device drivers for earlier versions of Windows do not work.
Reverting to the previous operating system enables you to continue using the application or device while waiting for a compatible update or replacement. You can choose to upgrade to Windows XP Professional at a later date.
To uninstall Windows XP Professional
In the Run dialog box, type appwiz.cpl, and then click OK.
In the Currently installed programs box, click Windows XP Professional, and then click Remove.
Follow the on-screen instructions to uninstall Windows XP Professional.
You can only uninstall Windows XP Professional if your computer meets all of the following requirements:
The computer was upgraded from Windows 98 or Windows Me.
The system partition uses the FAT or FAT32 file system. This is the default for computers upgraded from Windows 98 and Windows Me. If you use Convert.exe to convert the file system from FAT to NTFS, you can no longer uninstall Windows XP Professional.
The computer had sufficient disk space to save uninstall information when you upgraded to Windows XP Professional.
To detect incompatible components before upgrading to Windows XP Professional, run Setup with the /checkupgradeonly parameter.
To check system compatibility before installing Windows XP Professional
Insert the Windows XP Professional operating system CD into the computer, and then wait for the Welcome to Microsoft Windows XP screen to appear. Click Check system compatibility.
or
At the command prompt, type drive:\i386\winnt32.exe /checkupgradeonly (where drive: represents the network or CD ROM path to the Windows XP Professional installation files).
For more information about uninstalling Windows XP, see Windows XP Professional Help and Support Center. Also see articles Q303661, How to Uninstall Windows XP and Revert to a Previous Operating System , and Q303678, How to Uninstall Windows XP if Setup Will Not Continue During Upgrade . To find these articles, see the Microsoft Knowledge Base link on the Web Resources page at http://www.microsoft.com/windows/reskits/webresources
For more information about upgrading to, or deploying Windows XP Professional, see Planning Deployments in this book.