Project 3 Weights and Measures
Summary:
Students learn best when they make a personal connection to the subject at hand. In this activity, they become their own raw data to analyze, compare, and convert.
Objectives:
-
To master the gathering, averaging, and graphing of data
-
To practice conversion to metric measures
-
To gain fluency in use of technology tools for math operation
What to do:
Teachers' Preparation
-
Open MS Excel.
-
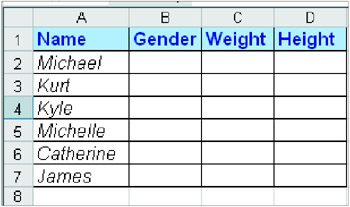
Create these headings: Name, Gender, Weight, Height.
-
Enter each of your student's names on a separate row under Name.
-
Save as Class Data.
-
Position the scale and tape measure near the computer on which this spreadsheet is loaded.
-
Gather the students around this computer, and explain that each person will work with a partner to weigh and measure themselves, then enter the results in the Class Data. When all the data is complete, each student will get a copy of the Class Data workbook to analyze, compare, graph, and convert, following the steps in the student activity.
-
After students have completed Step 1, make a copy of the filled out worksheet for each student, or save it in a common folder on your network so each students can copy it for use on his or her own workstation.
What to do: Student's Activity
STEP 1 Measure It
-
Go to the computer/weights and measures station your teacher has set up.
-
Find your name in the Excel workbook your teacher created. Under Gender, type F if you are a girl or M if you are a boy.
-
Weigh yourself on the scale, and enter your weight in the Weight column next to your name.
-
Choose a partner, and have him or her use the tape measure to find your height in inches. Enter this number in your Height column.
-
Let your partner find and enter his or her own weight. Then measure his or her height and enter this figure. Save the workbook.
STEP 2 Convert It
-
When everyone has entered weight and height data, you will get your own copy of the class Excel workbook.
-
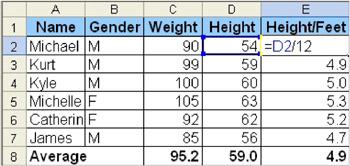
Go to cell E1 and type the heading, Height/Feet. In cell E2, create a formula to convert the first student's height in inches to height in feet by typing =(D2/12), which means "divide the figure in cell D2 by 12". Press Enter, and double-click the figure you see. You can now Autofill this same formula to convert all the heights to feet by clicking in cell E2, pointing to the "handle" in its bottom right corner, and dragging to the end of column E. To simplify your results, click at the top of column E, go to Cells, click on the Number tab, choose Number from the list, and type 1 for Decimal Places.
-
Now add three more columns: Weight in Grams, Height in Centimeters, and Height in Meters. Use the information in the Metric Measures box to create formulas that will convert each student's measurements into these metric numbers.
-
Save and print your work. Pair up with classmates to share and check results.
STEP 3 Average It
-
Get the average height and weight in your class.
-
In your class data workbook, add a row at the bottom of the class list. In the Name column, type Average.
-
In the Weight cell that shows weight in pounds, create a formula that will find the average weight of all the students in your class.
-
Check your results to make sure your formula is correct. If it is correct, Autofill it across the row. Save and check your work.
METRIC MEASURES
1 inch = 2.54 centimeters
1 foot = 1/3 of a meter, or .0305 meters
1 pound = 453.592 grams
STEP 4 Break It Down!
-
Figure out separate averages just for boys and for girls.
-
Select all your cells, including your headings. Filter it.
-
In the Gender column, click in the small box and a menu will appear. Select F.
-
Now, the only data you will see is for the girls. Select all the cells, go to Edit, and choose copy.
-
Go to Sheet 2. Make A1 the active cell and click paste.
-
Go back to Sheet 1. Click All from the filter box in the Gender column.
-
Repeat Step 3. This time, select M. Paste the boy's data in Sheet 3.
-
In Sheet 2, add a row labeled Average, find the girls' averages.
-
Do the same for the boys in Sheet 3. Save and check your work.
STEP 5 Graph It
-
To graph all the height in your class - including the average - select the Name column, then press Ctrl and select the Height column. Go the Insert and choose Chart.
-
Choose the desired chart type you want.
-
Now, try to create other charts. How about one that compares girl's weights to boys' weights? A chart of all class heights in centimeters? One that graph weight and height together?