Modifying and Creating Actions
Application Center installs several actions that can be associated with any monitors that you enable for the cluster or a cluster member. Figure 9.19 shows the default Actions in the console tree. The Actions view in the details pane displays the items that are associated with a selected action in the console tree; including the name of the monitor, its type, and the condition (threshold) that triggers the action. In the example illustrated in Figure 9.19, the action is Email Administrator, which is associated with several data collectors.
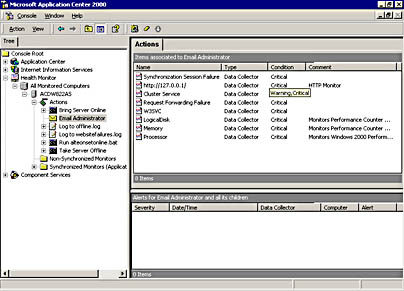
Figure 9.19 The monitors associated with the Email Administrator action
The Default Actions
Table 9.4 describes the default actions that Application Center provides.
NOTE
All the default actions are scheduled as follows. Days to run actions: Every day, Times to run actions: All day.
Table 9.4 Application Center Default Actions
| Name | Type of action | Description |
|---|---|---|
| Bring Server Online | Command Line | Uses the command-line tool with parameters to set the mem- ber back online when the monitors in the Offline/Online folder are good. |
| Email Administrator | Sends an e-mail message to the administrator with the specified message. | |
| Log to offline.log | Text Log | Logs a message to a text file each time the online and offline events are received. |
| Log to websitefailures.log | Text Log | Logs HTTP monitor failures to a text log with all of the properties that are returned from the request. |
| Take Server Offline | Command Line | Uses the command-line tool with parameters to set the member offline when a monitor in the Offline/ Online folder becomes Critical. |
You can modify any of the actions shown in Table 9.4 by opening the properties dialog box for the action (right-click the action name) and selecting the configuration information that you want to change.
Creating a New Action
Use the following procedure to create a new action:
-
Right-click the Actions node; on the pop-up menu, point to New; and then choose one of the following types of actions:
Command Line Action
E-mail Action
Text Log Action
Windows Event Log Action
Script Action
After you select the type of action that you want to use, the actionname Properties dialog box appears and you can configure the action.
Let's examine each of these action types, focusing on how the Details tab is configured for each action.
NOTE
The General and Schedule tabs are common to all actions and are configured as follows:
- General—Provide the action name and a descriptive comment.
- Schedule—Set to run all day, every day, by default. Change this by clearing the check box for specific days, specifying a period to include or a period to exclude. A good use for include/exclude is to specify different e-mail addresses to send alerts to during the week and on weekends.
Command Line Action Properties Dialog Box: Details Tab
You use this tab to specify the file name, path, command line, and parameters of the program that you want to run. The program runs when the threshold for the associated data collector is crossed.
- File Name—Enter the file name and path for the program to run. A Browse button is provided that enables you to browse to the program by using the Browse for File dialog box. After you select the program, the file name and path are inserted automatically.
- Working Directory—Enter the name of the working directory that you want to use for the program. A Browse button is provided that enables you to identify the working directory by using the Browse for Folder dialog box.
- Command Line—Enter the command. You can include insertion strings by clicking the right angle bracket (>) to the right of the Command Line box. See sidebar.
Insertion strings
The following set of insertion strings is supported and available for the actions.
- Error Code (from WMI)
- Error Description (from WMI)
- # of Instances Collected
- Embedded Collected Instance
- GUID
- Instance Name
- Formatted Local Time
- Message
- Name
- Parent GUID
- State
- Status GUID
- System Name
- GMT Time
You can also reference a property from the data collector by using the Embedded Collected Instance insertion string to specify the property to display.
- Process Timeout—Specify the maximum amount of time (in seconds, minutes, or hours) that the program is allowed to run before it is automatically terminated.
- Run In a Window—Select this check box to enable program visibility when it is running.
NOTE
The program will not be displayed in a Terminal Services window.
E-mail Action Properties Dialog Box: Details Tab
Use this tab to identify the SMTP server, e-mail recipients, and the e-mail message to send when the threshold for the associated data collector is crossed.
- SMTP Server—Enter the name of the SMTP server that will send the message. You can specify a fully qualified Domain Name System (DNS) name (for example, samples.microsoft.com) or an IP address.
- From—Enter the name of the monitor or e-mail address of the person who is sending the message. For example, Health Monitor, administrator@samples.microsoft.com.
- To—Provide the e-mail address of the message recipient. Optional buttons, Cc and Bcc are provided that enable you to identify recipients who should receive a copy of the e-mail message. Click either Cc or Bcc to activate an input dialog box. You can specify multiple recipients if you separate their names with a semicolon (;).
- Subject—Provide a subject line for the message or click the right angle bracket (>) to the right of Subject box to select an insertion string for the subject line. The available insertion strings are the same as those provided for Command Line. (See the preceding sidebar.)
- Message—Use the default text and insertion strings for the message or provide your own message and insertion strings. (See the preceding sidebar.) The default message is:
Health Monitor Alert on %EmbeddedStatusEvent.SystemName% at
%EmbeddedStatusEvent.LocalTimeFormatted%%EmbeddedStatusEvent.Message%
This message displays the server name, the time when the alert was fired, and the message property from the data collector or data group.
Text Log Action Properties Dialog Box: Details Tab
Use this tab to specify the text to write to the selected log file. The text is written to this log file when the associated data collector is crossed.
- File—Enter the name of the file to which you want to write information or click Browse to activate the Browse for File dialog box.
- Log size—Specify the maximum size allowed for the log file in bytes, KBs, or MBs.
- Text—Provide the text that should be written to the log. You can provide text and insertion strings. (Right-click the right angle bracket (>) to the right of the Text box to select insertion string; see the preceding sidebar.)
- Use ASCII Text/Use Unicode Text—Select the text format that you want to use. ASCII is indicated by default.
NOTE
Please note the following points regarding log files:- A log file is created automatically by using the name you specify if the file doesn't already exist.
- By default, new information is appended to a log file.
- After the log file reaches its size limit, a new file is created automatically.
Windows Event Log Action Properties Dialog Box: Details Tab
Use this tab to specify a Windows event that will be generated and automatically written to the Windows Event Log when a data collector's threshold is crossed.
Event type—Identify the type of Windows event notification to generate. The following options are provided for identify event severity:
- Information: describes the successful completion of an operation, such as running an application, loading a driver, or starting a service.
- Error: signifies a significant problem, such as loss of data or loss of functionality. A typical example is a service that fails to start.
- Warning: indicates that although there are no errors, the current state of an operation or device is such that a problem could arise in the future. For example, when disk space is low, the situation is not critical at the time the event is generated.
- Text—Provide the message text and/or insertion string(s) that will be written to the Event Log. (See the preceding sidebar.)
Script Action Properties Dialog Box: Details Tab
Use this tab to specify the name and path of the script that you want to run when a collector's threshold is crossed.
- Script type—Identify whether the script is written in VBScript or JScript. Enter the path for the file or, alternatively, click Browse to launch the Browse for File dialog box.
NOTE
You can edit the file you select by clicking the Edit button. This action opens the file in the default text editor, Microsoft Notepad. - Process Timeout—Establish a maximum time length that the script can run before its execution is halted. You can specify the process timeout in seconds, minutes, or hours.
Details Tab Configuration Examples
Table 9.5 uses the default actions to illustrate how different types of actions are configured.
Table 9.5 Examples of an actionname Properties Dialog Box Configuration for the Details Tab
| Action | Configuration |
|---|---|
| Bring Server Online | Filename: Ac.exe Command line: ac.exe loadbalance /online/memberonly Process timeout: 120 seconds |
| Email Administrator | SMTP server: Null From: HealthMonitor, To: Null Subject: %EmbeddedStatusEvent.Name% Alert on %EmbeddedStatusEvent.SystemName% Message: Health Monitor Alert on%EmbeddedStatusEvent.SystemName% at %EmbeddedStatusEvent.LocalTimeFormatted% %EmbeddedStatusEvent.Message% |
| Log to offline.log | File: Offline.log Log Size: 1048576 (Bytes) Text: %EmbeddedStatusEvent.SystemName%%EmbeddedStatusEvent.LocalTimeFormatted% %EmbeddedStatusEvent.Message% Use ASCII text |
EAN: N/A
Pages: 183