SQL Server Desktop Engine and ACLog
The Application Center Events and Performance Logging feature uses the Microsoft SQL Server 2000 Desktop Engine (also known as MSDE 8.0), which provides a small footprint data store—installed as a named instance—for logging monitoring data that is generated by each cluster member. This data includes events, performance, and page-level statistics.
Installation is optional (performance logging is enabled and the SQL desktop engine is installed by default), but before you decide not to install this option, you should carefully weigh the benefits of using this feature against the performance impact it will have on your servers. The Application Center implementation of the SQL desktop engine is tuned to minimize the impact that monitoring will have on a system. In addition to memory tuning, the stored procedures and queries that this service uses are optimized as well.
If you decide not to install the SQL desktop engine, several Application Center monitoring features will not work (they still appear in the user interface, but are not functional) because they depend on the SQL desktop engine. These features and possible workarounds for them are summarized in Table 7.8.
NOTE
The workarounds suggested in Table 7.8 have to be installed and configured on each cluster member, and they provide information on a per-machine basis, but not for the cluster as a whole, as does the integrated Application Center log feature set.
Table 7.8 Disabled Monitoring Features and Workarounds for an Installation Without Application Center Events and Performance Logging
| Feature | Workaround |
|---|---|
| Performance view | Use Windows 2000 Performance Monitor. |
| Event view | Use Windows 2000 Event Viewer. |
| Historical view | Use Windows 2000 Event Viewer. |
| Health Monitor events | Use a standalone installation of Health Monitor. |
| Archiving data | Develop your own method for archiving data. |
| Reporting | Develop your own method for reporting. |
The Application Center Log
With logging enabled, the SQL desktop engine and the Application Center monitoring database, ACLog, are created on each cluster member. In addition to the standard SQL system tables, this database consists of 11 Application Center–specific tables that are used to store event and performance information for each server. ACLog, normalized and indexed for optimum performance, serves two purposes.
- First, it provides event and performance information that provides real-time and short-term historical data that is collected and displayed in the user interface.
- Second, it provides an interim repository for performance data that can be extracted and archived in another database. The information in this database can be accumulated over a long period of time and used later for trend analysis and capacity planning.
NOTE
This SQL database runs as a named instance, which allows multiple copies of SQL Server 2000 to run on the same server. This, along with the fact that Application Center uses a different port number than SQL Server 2000, isolates the monitoring database from other installations of SQL Server. As a result, potential performance and security issues are eliminated when running the SQL desktop engine and Microsoft SQL Server on the same computer.
The database tables, their relationships, and primary keys are shown in the table diagram provided in Figure 7.12.
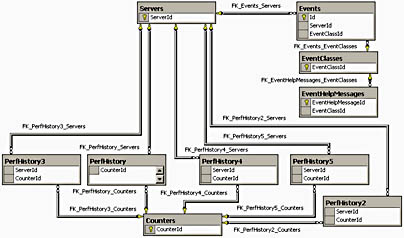
Figure 7.12 Database table diagram for the Application Center Log (ACLog)
Table 7.9 summarizes the data that is stored in each of the ACLog database tables.
Table 7.9 ACLog Database
| Table name | Used to |
|---|---|
| Servers | Store identifying information (for example, a globally unique identifier [GUID]) for each cluster member. |
| Events | Store unique event information, such as the server identifier and GUID, event class identifier, event generation time, and event data. |
| EventClasses | Store common event information such as: event severity, the event log, category or subcategory, the name displayed, short message, long message, and event description. |
| EventHelpMessages | Display the help message associated with a given event. |
| Counters | Store counter information such as: the counter name, counter status (active or inactive), the scale used, type of server or cluster data aggregation, and units of measurement. |
| PerfHistory | Store counter information that is collected every 10 seconds for active counters. The information stored includes the server and counter identifier, the time the data was collected, and the actual data. |
| PerfHistory2 | Store PerfHistory data that has been rolled up into one-minute intervals. |
| PerfHistory3 | Store PerfHistory2 data that has been rolled up into fifteen-minute intervals. |
| PerfHistory4 | Store PerfHistory3 data that has been rolled up into two-hour intervals. |
| PerfHistory5 | Store PerfHistory4 data that has been rolled up into twenty-four hour intervals. |
Application Center monitoring utilizes SQL stored procedures as well as table views. The stored procedures are used for maintaining database table information, and the table views are used for displaying information in the user interface.
Table Layouts
The table layouts for each of the tables described in the preceding section are shown in the following tables (Table 7.10 through Table 7.19).
Table 7.10 Servers
| Column/field name | Data type | Length | Allow nulls—default is no |
|---|---|---|---|
| ServerId | smallint | 2 | |
| ServerGUID | uniqueidentifier | 16 | Yes |
| __Server | nvarchar | 255 |
Table 7.11 Events
| Column/field name | Data type | Length | Allow nulls—default is no |
|---|---|---|---|
| Id | int | 4 | |
| GUID | uniqueidentifier | 16 | |
| ServerId | smallint | 2 | |
| EventClassId | smallint | 2 | |
| TimeGenerated | datetime | 8 | |
| Data | nvarchar | 2000 | Yes |
Table 7.12 EventClasses
| Column/field name | Data type | Length | Allow nulls—default is no |
|---|---|---|---|
| EventClassId | smallint | 2 | |
| EventId | int | 4 | |
| Severity | smallint | 2 | |
| [log] | varchar | 100 | |
| Category | nvarchar | 255 | |
| SubCategory | nvarchar | 255 | Yes |
| __Class | varchar | 255 | Yes |
| DisplayName | nvarchar | 255 | Yes |
| ShortMessage | nvarchar | 255 | Yes |
| LongMessage | nvarchar | 1000 | Yes |
| Description | nvarchar | 1000 | Yes |
Table 7.13 EventHelpMessages
| Column/field name | Data type | Length | Allow nulls—default is no |
|---|---|---|---|
| EventHelpMessageId | int | 4 | |
| EventClassId | smallint | 2 | Yes |
| HelpMessage | nvarchar | 300 | Yes |
Table 7.14 Counters
| Column/field name | Data type | Length | Allow nulls—default is no |
|---|---|---|---|
| CounterId | smallint | 2 | |
| Status | tinyint | 1 | |
| AccessType | varchar | 100 | |
| Scale | int | 4 | |
| ServerAggregation | tinyint | 1 | Yes |
| ClusterAggregation | tinyint | 1 | Yes |
| Name | nvarchar | 255 | |
| Units | nvarchar | 10 | Yes |
Table 7.15 PerfHistory
| Column/field name | Data type | Length | Allow nulls—default is no |
|---|---|---|---|
| ServerId | smallint | 2 | |
| CounterId | smallint | 2 | |
| TimeMeasured | datetime | 8 | |
| Data | float | 8 |
Table 7.16 PerfHistory2
| Column/field name | Data type | Length | Allow nulls—default is no |
|---|---|---|---|
| ServerId | smallint | 2 | |
| CounterId | smallint | 2 | |
| TimeMeasured | datetime | 8 | |
| Data | float | 8 | Yes |
Table 7.17 PerfHistory3
| Column/field name | Data type | Length | Allow nulls—default is no |
|---|---|---|---|
| ServerId | smallint | 2 | |
| CounterId | smallint | 2 | |
| TimeMeasured | datetime | 8 | |
| Data | float | 8 | Yes |
Table 7.18 PerfHistory4
| Column/field name | Data type | Length | Allow nulls—default is no |
|---|---|---|---|
| ServerId | smallint | 2 | |
| CounterId | smallint | 2 | |
| TimeMeasured | datetime | 8 | |
| Data | float | 8 | Yes |
Table 7.19 PerfHistory5
| Column/field name | Data type | Length | Allow nulls—default is no |
|---|---|---|---|
| ServerId | smallint | 2 | |
| CounterId | smallint | 2 | |
| TimeMeasured | datetime | 8 | |
| Data | float | 8 | Yes |
Table Views
Application Center uses a collection of table views (Figure 7.13) to store and display real-time event and performance data and short-term historical data in the user interface.
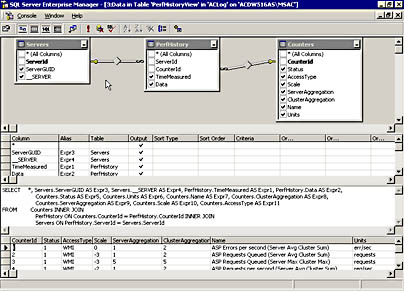
Figure 7.13 The PerfHistory table view with SELECT statement and SELECT statement output
The PerfHistory table view that's shown in Figure 7.13 illustrates how Application Center uses SQL SELECT statements and inner/outer joins to consolidate and provide information that can be displayed in the monitoring console. The table views that Application Center uses are summarized in Table 7.20.
Table 7.20 Table Views Used to Display Event and Counter Information
| Table name | Tables used for view |
|---|---|
| EventView | Events, EventClasses, Servers |
| EventDetailView | Events, EventClasses, EventHelpMessages, Servers |
| PerfHistoryView | PerfHistory, Counters, Servers |
| PerfHistory2View | PerfHistory2, Counters, Servers |
| PerfHistory3View | PerfHistory3, Counters, Servers |
| PerfHistory4View | PerfHistory4, Counters, Servers |
| PerfHistory5View | PerfHistory5, Counters, Servers |
TIP
If you're running SQL Server 2000, you can attach a cluster member's database to a SQL Server Group (New SQL Server Registration under the SQL Server Group node) and view the table views that Application Center uses. Examining the code for these views will give you some ideas for creating your own views of the data that Application Center stores in ACLog.
ACLog Capacity Requirements
Because the SQL desktop engine has a capacity limitation of 2 GB, storage requirements for event and performance logging over a given period need to be considered. The following information, based on estimates, provides some guidelines for the storage requirements for event and performance counter data.
Event Logging
Two factors influence the size of the event log:
- The number of events received per hour.
- The size of the event data field, which is determined by the values that are used for substitution and other event data.
The estimated record size for an event is 32 bytes for the identification field and a variable length for the data field.
NOTE
The number of days that event log information is retained is stored in WMI, and that number is configurable through the user interface. The Cleanup stored procedure reads this information (set at 15 days as the default clean-up interval) and deletes records from the Events table whose TimeGenerated is greater than the clean-up interval.
Performance Counter Logging
Each performance counter record is 20 bytes. Counter storage requirements are determined by:
- The number of active counters in use.
- The length of time that counter data is stored.
The primary purpose of performance counters is to provide information that has some immediacy, that is to say, what is happening on a server now. This requires high-resolution counters plotted over a short period of time (from 10 through 15 minutes). Once this requirement is fulfilled, lower resolution counters—counters in which performance data is rolled up and aggregated to a less granular level—can be used to plot performance over longer periods. These graphs can help you identify trends by showing relative performance (high and low points), as well as showing day-to-day changes in server/cluster performance.
NOTE
Since the performance chart can display only a limited number of plot points, aggregation needs to take place in order to plot performance data over time periods greater than 10-15 minutes.
Table 7.21 summarizes the roll up frequency and storage periods for the performance data that's stored in the various performance history tables. The period of time that the monitoring user interface requires this data for is also provided.
Table 7.21 Counter Retention Periods and Roll Up Frequency
| Table name | Counter interval | Roll up frequency | Retention period | Time used by user interface |
|---|---|---|---|---|
| PerfHistory | 10 seconds | Every minute | 1440 minutes (24 hours) | 15 min |
| PerfHistory2 | 15 minutes | Every 15 minutes | 1440 minutes (24 hours) | 2 hours |
| PerfHistory3 | 2 hours | Every 2 hours | 1800 minutes (30 hours) | 1.25 days |
| PerfHistory4 | 1 day | Every day | 14400 minutes (10 days) | 9 days |
| PerfHistory5 | 1 day | No rollup | 180000 minutes (125 days or approximately 4 months) | 17 weeks |
The type of rollup, or aggregation, that's used for each counter is specified in the ServerAggregation field of the Counters table. The following list summarizes the types of aggregation (and corresponding field code) that are used by Application Center.
- Average of Values—1
- Sum of Values—2
- Last Value—3
- Min Value—4
- Max Value—5
NOTE
The type of aggregation that should be used for a performance counter depends on several factors, which are covered in Chapter 10, "Working with Performance Counters."
After performance counter data is no longer required by the monitoring user interface, the data is purged from the performance log tables by the Cleanup stored procedure.
Now that you possess the necessary background information, let's examine Application Center monitoring in its entirety, starting with the major steps in the monitoring process.
EAN: N/A
Pages: 183