Health Monitor 2.1
Before examining Health Monitor's architecture and features, let's cover the basic monitoring terminology that's used by Health Monitor and Application Center.
- Data collector—A data collector receives and stores WMI data. A data collector represents the worst state of its child thresholds. Through the Health Monitor snap-in, you can create and configure data points to specify which data to collect, when, and from which server. You can group related data collectors into a data group.
- Data group—You can use the user interface to create a data group, which provides a means for grouping related data points into a category.
- Threshold—A threshold is a boundary that you can set to establish criteria for generating alerts. When the threshold is crossed, a data collector's state changes and the appropriate alert reflects this change. For example, the CPU utilization state can change from OK to Critical.
- Event—An event is any occurrence of interest related to managing computer hardware, software, and applications. Typically, an event is tied to an action or an alert. For example, the W3svc Service fails to start on a cluster member. This event results in two actions: first, a WMI event is sent, and second, an alert notification is displayed in the Alert view.
- Alert—An alert is the interpretation of an event or collection of events that results in a message being sent to the Health Monitor snap-in. For example, when the threshold for CPU utilization is exceeded, the system interprets this information and generates an alert.
- Action—An action is the monitoring system's automated response to a specified condition. An action is in response to an alert and can range in severity from displaying a message on the console to shutting down the entire system. For example, an e-mail notification is sent to a specified user when a threshold is exceeded.
High-Level Architecture and Operation
At the highest level, Health Monitor consists of two components: the Health Monitor snap-in and the Health Monitor agent. During installation, you have the option of installing either or both these components on the local server.
NOTE
During installation Application Center installs both the Health Monitor snap-in and agent on the server.
The monitoring snap-in is installed in client-only mode during setup. Through this snap-in you can add computers and edit their monitoring configuration settings, provided that you are logged on as a user with administrative privileges on the target computer. Application Center requires that configuration settings be changed only by a user account that has administrative privileges. All other logons function in operator-only mode, which allows them to view monitoring information and enable or disable a monitor.
The agent gathers data through its data collectors, tests for threshold violations, and generates alerts. Figure 7.5 provides a rudimentary diagram of the Health Monitor architecture as it's implemented by Application Center.
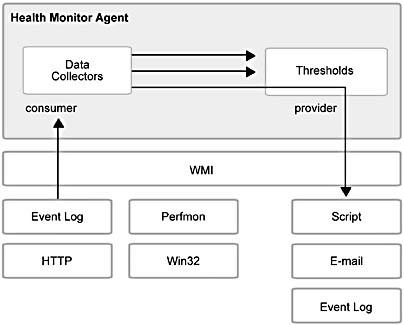
Figure 7.5 The Health Monitor console and agent architecture
Health monitoring is set up in two steps by using .mof files. The first .mof file defines the namespace and sets up the agent. This .mof file gets compiled and placed into WMI when Health Monitor is installed on a server that's going to be monitored. Next, Application Center compiles a second .mof file that contains the default monitoring rules and policies.
Each agent runs independently on a single server and is unaware that a console is monitoring its activities. The agent continues collecting data, monitoring thresholds, generating events, and responding with actions. The Health Monitor design is such that a minimal amount of code is required for the agent. The console handles general communications between itself and the agent and provides support for features, such as the heartbeat. The console's Connection Manager (Figure 7.6) is responsible for handling Health Monitor communications between servers.
Figure 7.6 provides a more detailed view of the Health Monitor architecture. As you can see in this diagram, Health Monitor implements several of its own custom providers to supplement those supplied by WMI.
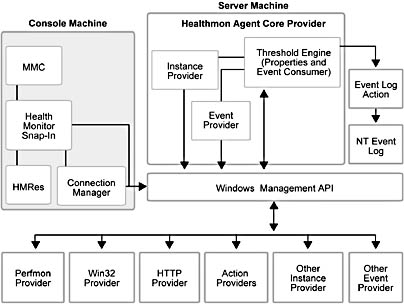
Figure 7.6 The Health Monitor 2.1 architecture
The Health Monitor Agent
The agent is a provider and consumer of WMI data. The agent runs on monitored computers and collects data as well as evaluates thresholds. It also generates alerts and manages actions when thresholds are crossed.
The Health Monitor agent utilizes several providers that ship with the product, including the following:
- Core Agent
- Win32
- HTTP
- COM+
- Ping
- TCP/IP Port Connect
Health Monitor Classes
There are three distinct types of classes in Health Monitor: configuration classes, status classes, and event classes. Figure 7.7 illustrates this hierarchy of classes and how they are interrelated. Chapter 9, "Working with Monitors and Events," describes these classes and their associations in detail.
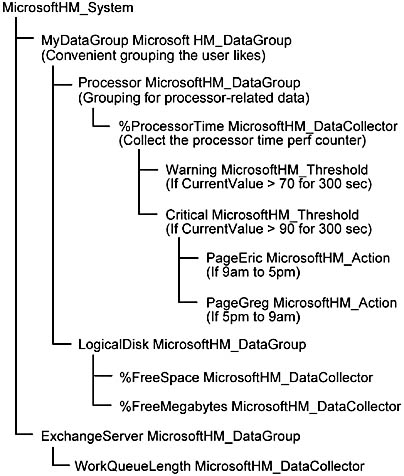
Figure 7.7 An illustration of class relationships for a monitor with data collectors, thresholds, and actions
Configuration classes are used for configuring the agent provider by telling it what data to collect and what thresholds are run. The primary classes are MicrosoftHM_DataCollectorConfiguration and MicrosoftHM_ThresholdConfiguration, and their properties encompass:
- When to poll the WMI class or register for an event.
- What to look at.
- The threshold value.
- The duration for which the value must remain.
- Which state to change to.
- Associated actions.
Since these configuration classes are stored statically in WMI, the agent is a consumer of instances rather than a provider.
With the status and event classes, the agent is an instance and event provider, respectively. For each configuration class there is a corresponding status class. For example, in the MicrosoftHM_SystemConfiguration class, you can enable or disable monitoring. The agent provides an event from the MicrosoftHM_SystemStatusEvent class when the state of the computer changes. This state is also reflected in the MicrosoftHM_SystemStatus class. The console acts as a consumer for these events to display the correct icon in the user interface.
Core Agent Provider
The best way to understand how the Health Monitor agent works is to examine the workings of the Core Agent Provider, which handles the bulk of the Health Monitor agent's processing activities.
When the provider starts, it reads in the information that it requires from instances of the following classes: MicrosoftHM_SystemConfiguration, MicrosoftHM_DataGroupConfiguration, MicrosoftHM_DataCollectorConfiguration, MicrosoftHM_ThresholdConfiguration, and some association classes.
The Core Agent Provider collects instances in three ways:
- Via the GetObject WMI API call—instances of the MicrosoftHM_PolledGetObjectDataCollectorConfiguration class.
- By executing a query that returns an instance as a response—instances of the MicrosoftHM_PolledQueryDataCollectorConfiguration class.
- By registering a query to receive events (limited only by the length of time the query is active)—instances of the MicrosoftHM_EventQueryDataCollectorConfiguration class.
After this information is obtained, the provider is fully initialized and ready for operation.
NOTE
Because the Core Agent Provider is also registered as a temporary consumer to receive events for instance modification and the deletion and configuration of the configuration classes, it can alter its behavior. These events occur when the console or a third-party tool needs to alter the work of the provider.
The Core Agent Provider, operating on a polling interval, loops through all the HMDataCollector instances and determines which ones need to collect their data. Those that have reached their time interval execute the appropriate query, method, or GetObject and collect their data.
Each instance is then evaluated to see whether or not a threshold on a property was crossed.
NOTE
In cases where the threshold is based on a time period (duration), threshold violation must occur over successive collection intervals for the specified duration in order to be flagged as a valid violation.
Threshold tests against the data may be for different values: current property value, average property value, or number of instances returned, respectively. An additional test, Difference, can test for the difference between the current value of a counter and the value from a previous collection pass. However, only a single property may be evaluated in a threshold.
For thresholds that are crossed, the Core Agent Provider creates a status event (whose message is contained in the MicrosoftHM_ThresholdStatus class). If this threshold causes a state change in a parent data collector, data group, or the system, an event is fired from their event class as well. Status events are sent only when there is a state change, and only for the classes that had a change. This information can be pushed to the Windows Event Log by using an action, where it can then be accessed by the console. In addition, data collector state changes are logged to the Application Center event log.
The event-based instance collection works in much the same fashion, except that instances can come in at any time. Regardless of when these instances are received, they are evaluated only at the end of a specified collection interval.
Other Providers
Among the providers that Health Monitor uses, the HTTP and COM+ providers are important for monitoring Web servers and clusters.
HTTP Provider
The HTTP Provider is a WMI Instance Provider that supports the required interfaces for exposing the WMI Instance Provider services. The HTTP Provider monitors HTTP requests and responses, using WMI, and provides statistics to a monitoring tool—such as Health Monitor—on the status of Web application availability and performance.
Through the HTTP Provider, Application Center can use Health Monitor to execute HTTP requests and receive responses. This enables you to programmatically monitor Web application performance and availability. You can then direct the server to perform specific actions based on the information that's received.
NOTE
Because the HTTP provider class does not use WinInet, it is safe for server-side use.
COM+ Provider
The COM+ Provider is a WMI Instance Provider that supports the required interfaces for exposing the WMI Instance Provider services. You can use the COM+ Provider to collect and monitor COM+ data by using WMI. It provides statistics on the status of COM+ application availability and performance.
In addition to providing a statistical view of COM+ server behavior, the provider can be configured to provide notifications when defined thresholds are met or exceeded. The provider also gives you access to information that is not easily available, such as failure shutdowns, object activations, or committed transactions. Because the provider enables you to select specific COM+ applications to monitor (as well as customize data that's collected), the processing overhead needed to gather all of the COM+ objects and events information for an application is minimal.
The Health Monitor Snap-in
The Health Monitor snap-in is the graphical user interface that you use to administer Health Monitor and view the state of a configured object. The Health Monitor snap-in is like other Microsoft Management Console (MMC) snap-ins; the console tree enables you to administer objects—monitors and groups in this case—and the details pane displays corresponding status information. Health Monitor splits the details pane into two sections for presenting information: the upper part displays details and statistics, and the lower part displays alerts, as shown in Figure 7.8.
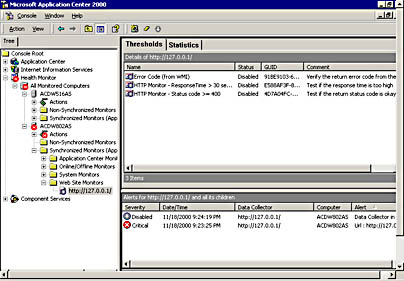
Figure 7.8 The Health Monitor snap-in and its views for displaying information
Monitor Statistics and Alerts
The details pane for a monitor shows statistical information and alerts for a monitored object that you highlight in the console tree. In the example shown in Figure 7.8, the monitor is one that checks for the presence of a default home page at http://127.0.0.1 (ACDW516\Synchronized Monitors\Web Site Monitors) when one of two thresholds is passed. The Details view displays the following data:
- Status—Disabled. The monitor is not running.
- Threshold Name—A violation will occur if one of two thresholds is crossed, the response time is greater than 30 seconds, or the status code returned is greater than or equal to 400.
- Last Alert—Not applicable, because no alerts have been generated.
Statistics View
Figure 7.9 shows the statistical information that is available for the monitor. Gathered by its data collector, this information includes Property and Instance information, and if desired, values (such as Current, Minimum, Maximum, and Average) returned for the last test, which is date and time stamped (Last Update). Statistics are shown for all properties selected in the data collector configuration and used in thresholds. Statistics are useful to see information, such as the current value of performance counters or headers returned by a Web server.
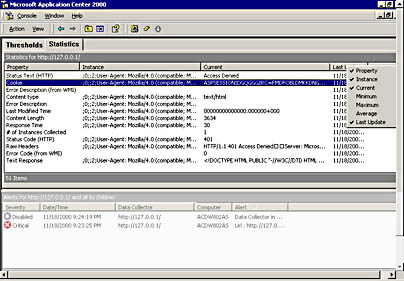
Figure 7.9 Statistical information available on the Statistics view
Alerts View
The Alerts view, shown in Figure 7.10, displays Alert notifications that are generated for the monitor. The Alerts view shows:
- The Severity of the alert (Reset, Warning, Critical, Disabled, and so on).
- The Date/Time of the alert.
- The name of the Data Collector.
- The name of the Computer the monitor is running against.
- An Alert message, if provided.
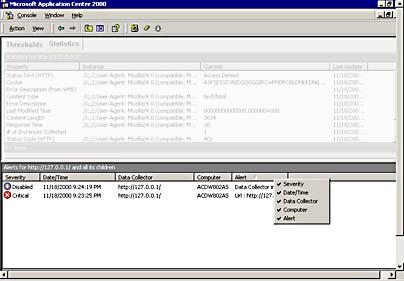
Figure 7.10 The Alerts view for a monitor
In addition to customizing the Alert view to display selected information, you can sort alerts on each of the fields that are displayed, by severity or by date and time, for example.
Console Tree
The console tree provides the primary administrative interface for specifying which computers to monitor as well as creating and modifying the monitors for a system. Figure 7.11 provides a graphical representation of the monitoring functions that you can access from the console tree in the Application Center implementation of Health Monitor. The console tree that's illustrated is based on a standard Application Center installation—it does not include elements that are added if you decide to do a custom setup and install all the sample actions and monitors that are available.
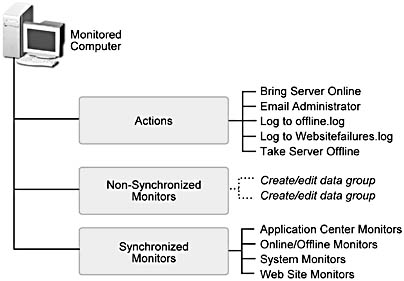
Figure 7.11 Graphical representation of the Application Center Health Monitor console tree showing the major nodes and sub-nodes
The four major nodes for a monitored computer are:
- Actions—This node is used to store and manage the actions. The default actions installed by Application Center are: take a server online, take a server offline, e-mail administrator, log on to Websitefailures.log, and log on to Offline.log
- Non-Synchronized Monitors—This node contains monitors that you can configure for use on individual members. These monitors are not replicated across a cluster.
- Sample Monitors—If you chose the default Application Center installation, this node is not created. With a custom installation, however, you can install a collection of sample monitors that are provided with Application Center. You can customize these samples to suit your particular cluster environment. You can always add these samples later by running the setup program again. The Program Maintenance dialog box, in Setup, has a Modify option that lets you change the features that are currently installed. Additionally, the file Samples.mof can be copied from the installation CD and compiled by using Mofcomp.exe.
- Synchronized Monitors—Application Center installs a collection of synchronized monitors by default. These monitors are grouped into the following categories: Application Center monitors, Online/offline monitors, System monitors, and Web Site monitors. This collection of monitors is synchronized across the cluster, and their configuration is replicated to every member. If this data group is deleted, it will be re-created the next time the system runs a full synchronization.
EAN: N/A
Pages: 183