Monitoring
In order to successfully maintain a production environment, you must be able to monitor the behavior and performance of its key components: the network, servers, and applications. A robust monitoring environment—one that provides real time and historical data—enables you to keep an eye on the overall health and performance of any given system. (Historical performance data is particularly useful when it comes to capacity planning.)
Application Center provides a central viewing point for obtaining this kind of information, which is encapsulated by the monitoring and logging of event, performance, and health data.
For detailed information about this feature, see Chapter 7, "Monitoring," Chapter 9, "Working with Monitors and Events," and Chapter 10, "Resolving Performance and Capacity Issues."
Events
Numerous objects and applications running on a server or cluster generate events—actions that take place on your server or cluster.
NOTE
All of the Windows 2000 events and some of the Application Center events are also logged in the Windows event log.
The more than 300 events relating to cluster functionality come from the 3 main sources summarized in Table 2.8. All the events that you can view are ranked by their severity (Table 2.9).
Table 2.8 Application Center Event Sources
| Source | Description |
|---|---|
| Windows 2000 | All the events logged by Windows 2000 in its event log. Application Center allows you to view these events by severity, source, time frame, and date generated. |
| Health Monitor | Health Monitor logs these events whenever established thresholds are exceeded. |
| Application Center | Various Application Center services, such as load balancing, generate and log events. Some error-related events are also logged in the Windows 2000 event log. |
Table 2.9 Event Severities
| Severity | Description |
|---|---|
| Informational | Describes the successful operation of an application, driver, or service. For example, it informs you when a network driver has loaded successfully. |
| Warning | The event is not of major significance, but may indicate a possible future problem. For example, you will receive a warning when disk space is low. |
| Error | Indicates that a significant problem has occurred, such as loss of data or loss of functionality. For example, an error will occur if a service has failed to load during startup. |
By activating the Event view in the console tree, you can view all the cluster and server events that are captured together or by specific category.
Figure 2.7 illustrates the Events report for our cluster member. Using the provided lists, you can specify an events category (All, Application Center, HealthMon, and Windows) and an events type (All, Errors, and Errors and Warnings). You can also apply specific filters to the Events report. In the example shown, only Application Center-specific events are displayed.
In addition to the summary event information listed at the top of the details pane in Figure 2.7, detailed information for a selected event is displayed at the bottom of the details pane. In addition to the online Help (MMC toolbar) and context-sensitive Help, you'll notice that the lower portion of the details pane provides additional information about an event. First, it provides a link to expanded information about the event itself. Second, it provides a link to the Microsoft Support Online site, where you can obtain related information, from sources such as Knowledge Base articles.
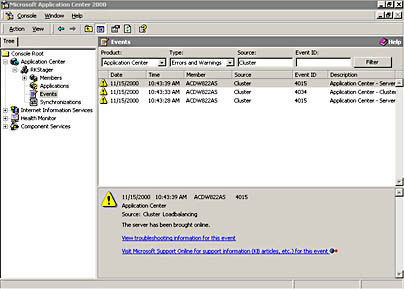
Figure 2.7 Cluster member events report
Performance
Performance is indicated by a collection of performance counters that indicate the amount of resource consumption. The counters may indicate, for example, that 70 percent of the total hard disk is space is in use, or that there have been 1,897 requests per second for the WWW Service.
Application Center uses a set of default counters to give you an overview of both server and cluster performance. These counters cover a broad range of system-related information, from the amount of available memory to the number of ASP page requests serviced per second. You can view these counters either in real time or for a selected time frame. Detailed information about these counters is provided in Chapter 7, "Monitoring," as well as Chapter 10, "Resolving Performance and Capacity Issues," which covers cluster performance metrics and tuning.
For example, the current server performance (Figure 2.8) for ACDW822AS is summarized as a chart in the details pane. The available graphs cover several time periods relative to the present time and are available in time segments of 15 minutes, 1 hour, 1 day, 1 week, and 3 months. Figure 2.8 plots the available memory in bytes and the processor utilization (as a percentage).
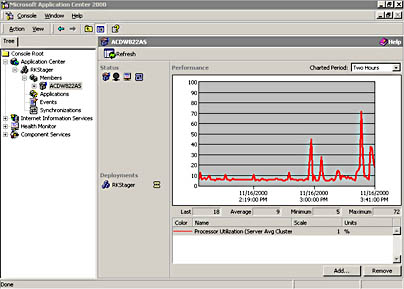
Figure 2.8 Server performance summary
By presenting these different views, Application Center enables you to assess the current level of performance in the context of past behavior. You have access to enough data to determine whether or not the present performance picture is an anomaly, represents a trend, or is part of a cycle.
Health
Application Center creates several default data collectors—with pre-defined thresholds—for use in monitoring server and cluster health. Some of the default collectors are toggled as active, while others are inactive and can be activated at any time.
NOTE
Data collectors are used to collect, receive, and retain specific WMI data.
You can also use the Health Monitor console to create and configure custom data collectors to expand the scope of the health monitoring features provided by Application Center. The product also supports the use of local monitors and thresholds, in addition to its global monitors.
Local and Global Monitors
By default, Application Center creates only global monitors. However, you might want to create local monitor thresholds to meet specific needs. For example, one of your cluster members might have a smaller hard disk than the rest, and the global threshold for disk usage (let's say, 80 percent) might be too high for this member. You can set the local threshold at 70 percent to give yourself more leeway for responding to a disk full situation.
The ability to set local monitors gives you greater flexibility, but keep in mind that it can also increase monitoring complexity.
There are three ways to create local monitors:
- From scratch by using the Health Monitor snap-in.
- By copying and modifying existing monitors in the Health Monitor snap-in.
- By developing classes with Managed Object Format (.mof) files, and then compiling them for use by WMI.
WARNING
Changing monitors for a specific cluster member will cause that member to be out-of-synch with the rest of the cluster from a monitoring perspective. Unless this change is made correctly, Application Center will overwrite your changes and restore the default settings during the next synchronization cycle.
Figure 2.9 shows the Monitors view for ACDW822AS, the cluster controller for the staging cluster.
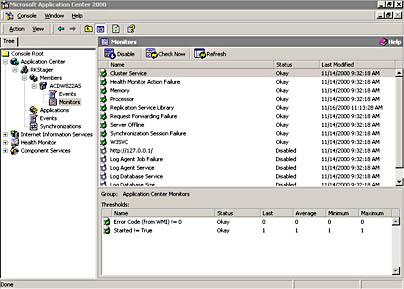
Figure 2.9 Server Monitors view
EAN: N/A
Pages: 183