Lesson 2:Index Tuning and Database Partitioning
3 4
Database optimization begins during the design process and is further refined by tuning, using tools such as the System Monitor and implementing system configuration changes such as upgrading SQL Server computers with multiple disk controllers, redundant array of independent disks (RAID) disk controllers, and disk arrays. A thorough exploration of database optimization is a book unto itself and is thus beyond the scope of a single lesson. Therefore, this lesson explores one optimization tool, the Index Tuning wizard, and a system configuration change to improve performance, reorganizing data through partitioning. For more information on database optimization, see "Optimizing Database Performance" in SQL Server Books Online.
After this lesson, you will be able to:
- Explain how partitioning is an important part of database optimization.
- Use the Index Tuning wizard to improve query performance.
Estimated Lesson time: 25 minutes
SQL Server Tuning
Achieving excellent database performance begins with careful database and application design. For example, building a normalized or moderately denormalized database, creating effective indexes, only using cursors when absolutely necessary, and using stored procedures instead of Transact-SQL batches. Upgrading the database hardware and relocating elements of the database, such as the underlying files or tables in a database, can also improve performance. Before making system changes, establish a performance baseline by using tools such as SQL Profiler and System Monitor. Then, after any tuning procedure, rerun the performance tests and compare the results to the benchmark. These steps will help you determine the impact of your change. Sometimes an intended tuning procedure actually causes performance degradation. The baseline data helps you determine if the change was positive and if so, how large of a performance gain was achieved by the change.
Index Tuning Wizard Overview
In earlier chapters, you learned about and used the Show Execution Plan option in Query Analyzer. By enabling this option, you are able to view a graphical representation of the execution plan selected by the Query Optimizer. Another way to view a query plan selected by the Query Optimizer, without also returning a result set from executing a query, is by enabling the SET SHOWPLAN_TEXT or SET SHOWPLAN_ALL commands. Query Optimizer determines the best way to execute a query based on such things as available indexes and the database table structure, but it doesn't recommend ways to improve query performance. A sound database design is always the first way to optimize query performance. Once the database is constructed properly, you can then use the Show Execution Plan option and the SHOWPLAN commands to help you figure out ways to optimize query performance. However, the most direct way to improve query performance is by running the Index Tuning wizard.
Using the Index Tuning wizard, you select and create an optimal set of indexes and statistics for a database even if you don't have an expert understanding of database structure, workload, or SQL Server architecture. Index Tuning wizard analyzes a workload to determine the optimal set of indexes that should be in place. A workload consists of a SQL script or a SQL Profiler file trace or table trace. The SQL Profiler trace must contain either the SQL:Batch event classes in the TSQL collection or the RPC event classes in the Stored Procedures collection and the Text and Event Class data columns to provide meaningful data for analysis. In Exercise 1, you created a workload using a template containing SQL:Batch event classes and both the Text and Event Class data columns, among others.
Using the workload and the execution plans built by the Query Optimizer, the Index Tuning wizard:
- Recommends the best mix of indexes for a database and ways to tune the database for a set of problem queries.
- Analyzes the effects of the proposed changes, including index usage, distribution of queries among tables, and performance of queries in the workload.
You can customize the recommendations by specifying advanced options such as how much disk space can be used by new indexes. A recommendation consists of SQL statements that, when executed, create more effective indexes and optionally drop existing indexes that are inefficient or unnecessary. Index Tuning wizard recommendations are applied immediately, scheduled for later application, or saved to a script for manual execution. Index Tuning wizard recommendations are somewhat limited in that they do not include index creation for tables referenced by cross-database queries and system tables. Tables created with PRIMARY KEY constraints and unique keys automatically generate indexes for these keys. Therefore, the Index Tuning wizard does not recommend indexes for tables containing these attributes, but it can drop or replace a clustered index that is not unique or is not created on a PRIMARY KEY constraint. There are other limits associated with the Index Tuning wizard. For more information, see SQL Server Books Online.
NOTE
The Index Tuning wizard does not generate an error when saving a SQL Script to a disk with insufficient space.
Running the Index Tuning Wizard
You can start the Index Tuning wizard from Enterprise Manager, Query Analyzer, or SQL Profiler. In Enterprise Manager, the Index Tuning wizard is a listed wizard in the Select wizard window. In Query Analyzer, the Index Tuning wizard is an option in the Query menu, and in SQL Profiler it's an option in the Tools menu. When you start the Index Tuning wizard, an introductory screen appears, as shown in Figure 14.3.
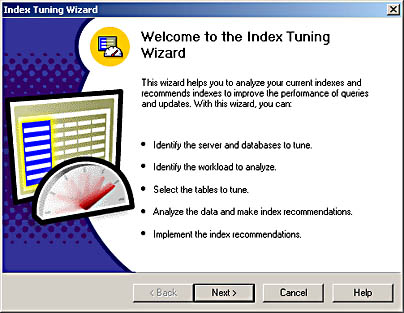
Figure 14.3 The introductory screen of the Index Tuning wizard.
After connecting to the server, the Index Tuning wizard requires that you select a database and specify whether you want to keep the existing indexes, whether you want to create indexed views, and how thorough of an analysis should be performed. The wizard does not recommend that any indexes be dropped if the Keep All Existing Indexes checkbox is selected. Recommendations will include only new indexes. If you are running SQL Server 2000 Enterprise Edition or Developer Edition, the Index Tuning wizard can create indexes on views if the Add Indexed Views checkbox is selected. The more thorough the analysis, the more significant will be the CPU consumption while analysis is being performed. If CPU consumption is a problem, take any of the following measures:
- Lower the level of analysis by selecting the Fast or Medium tuning modes. However, a thorough analysis can result in a greater overall improvement in performance.
- Analyze a smaller workload and fewer tables.
- Run the analysis against a test version of the production server. Save the results to a script and then run the script against the production server.
- Run the wizard on a client computer, not the SQL Server.
After you select the Index Tuning wizard configuration, you must select a workload. Workload data comes from a trace file or trace table or a selection in the Query Analyzer. The Query Analyzer selection option is available only if you start the Index Tuning wizard from the Query Analyzer. Do not include index or query hints in the workload. If you do, the Query Optimizer formulates an execution plan based on the index hints, which might prevent the selection of an ideal execution plan.
After you select the workload, you can change the default index tuning parameters, select the tables for the wizard to analyze, and then run the analysis. Following the analysis, the wizard might not make index suggestions if there isn't enough data in the tables being sampled or if recommending indexes do not offer enough projected improvement in query performance over existing indexes.
Partitioning Overview
There are a number of ways to partition the components that make up a database system. For example, the database and log files can be moved to drives that provide fast disk I/O, tables can be split across member databases, additional processors can service individual SQL Server worker threads, and the processing load can be split across multiple servers. Adding hardware increases the partitioning options available to you.
File and Disk Partitioning
Spreading the database files and log files across multiple disks can improve disk I/O, leave room for additional file growth, and decrease the amount of file fragmentation that might occur on a single disk. Create files or filegroups on as many different available local physical disks as possible and place objects that compete heavily for space in different filegroups. Add multiple disk controllers, RAID disk controllers, and RAID arrays. If you create a RAID array, configure the array into a fault-tolerant stripe for critical data. You might consider placing temporary tables on a striped array that is not fault-tolerant. This type of array configuration provides the best performance, but you run the risk of data loss.
Federated and Clustered Servers
Federated servers are computers that are managed independently, but cooperate to process the database requests from applications. Clustered servers are a group of computer systems known as nodes or hosts that work together as a single system to improve availability. A database located on federated servers optimizes performance only if the application sends each SQL statement to the server that has most of the data required by the statement. This is called collocating the SQL statement with the data required by the statement.
Distributed Partitioned Views
In a federation of servers, each server runs SQL Server 2000 and is called a member server. Each federated server runs a member database that contains part of the data. The tables in the database are horizontally partitioned into member tables. There is one member table per member database, and distributed partitioned views are used to make it appear as if there is a full copy of the original table on each member server. A distributed partitioned view is composed of multiple tables that are spread across more than one server. To create a distributed partitioned view, you replace the original table with several smaller member tables that are located on member databases. Each member table has the same number of columns as the original table, and each column has the same attributes (such as data type, size, and collation) as the corresponding column in the original table.
Exercise 2: Tuning Queries Using the Index Tuning Wizard

In this exercise, you will run the Index Tuning wizard and load the SQL Profiler trace you created in Exercise 1. You will then allow the Index Tuning wizard to create the recommended indexes. In the last two practices, you will rerun the SQL Profiler trace using the trace template created in Exercise 1 and then you will open Trace01 to see if query performance improves from index creation.
To configure and run the Index Tuning wizard
- Open Query Analyzer, and connect to your local server.
- In the Editor pane of the Query window, type any character or press the space bar.
You must take this action for the Index Tuning wizard to be an available option in the Query pull-down menu.
- Click the Query menu and then click Index Tuning wizard.
The Welcome to the Index Tuning wizard screen appears.
- Click Next.
The Select Server And Database screen appears.
- Select BookShopDB from the Database drop-down list box and click Next.
The Specify Workload screen appears. Notice that the Query Analyzer radio button is selected. This option is available only when you start the Index Tuning wizard from Query Analyzer.
- Click the My Workload File radio button.
An Open window appears and Trace01.trc is listed in the folder and file pane.
- Double-click Trace01.trc.
The path and file name of the trace file appears in the Specify Workload screen.
- Press the Advanced Options button to review the index tuning parameters and then click Cancel.
- Press Next on the Specify Workload screen.
The Select Tables to Tune screen appears.
- Scroll down in the list and select the [dbo].[table01] checkbox.
- Click Next.
The analysis runs as the Index Tuning wizard determines the type of indexes to recommend. When the analysis completes, the Index Recommendations screen appears and two indexes are recommended. Below the index recommendations a bullet shows the estimated query performance improvement based on the sampled workload.
The Index Tuning wizard recommends a clustered index named Table011 with a key on the UniqueID column and a nonclustered index named Table012 with a key on the Col03 and LongCol02 columns. Later in the Index Tuning wizard screens, you can choose to save a script to create these indexes. You can customize the script before executing it. For example, you might want to name the indexes differently.
- Click the Analysis button and review the various reports available from the Reports drop-down list box, then click Close.
- In the Index Recommendations screen, click Next.
The Schedule Index Update Job screen appears.
- Click the Apply Changes checkbox and then click Next.
The Completing The Index Tuning wizard screen appears.
- Click Finish.
The database is updated with the recommended changes and then a message box appears, indicating that the Index Tuning wizard has successfully completed.
- Click OK to close the Index Tuning wizard.
Leave Query Analyzer open to complete the next practice.
To test query performance
- Open SQL Profiler.
- Click File, point to New, and then click Trace.
The Connect to SQL Server dialog box appears.
- Click OK.
The Trace Properties dialog box appears.
- In the Trace Name text box, type Trace02.
- In the Template Name drop-down list box, select SQLProfiler_Exercise1.
- Click the Save To File checkbox.
The Save As window appears and Trace02 is the default file name.
- Click Save.
The trace file is saved to the My Documents folder and the Trace Properties dialog box reappears.
- Leave SQL Profiler open but do not click Run on the Trace Properties dialog box.
- Switch to Query Analyzer.
- In the Editor pane of the Query window, enter but do not execute the following code:
USE bookshopdb SELECT col03, longcol02 FROM table01 WHERE col03 = 'a' SELECT uniqueID, longcol02 FROM table01 WHERE uniqueID = 10000 SELECT * FROM table01 WHERE uniqueid BETWEEN 5000 AND 10000 GO
- Switch to the SQL Profiler window.
- In the Trace Properties dialog box, click Run.
The two-paned trace window appears and four data columns appear in the top pane.
- Switch to the Query Analyzer and run the SELECT statements.
- Switch to the SQL Profiler and watch as the trace captures the Transact-SQL activity.
Trace data appears in the top pane of the trace window.
- When a record appears containing SQL:BatchCompleted in the EventClass column, click the red square on the toolbar to stop the trace.
- An additional row is added to the top pane of the trace window, indicating that the trace stopped.
Leave SQL Profiler and Query Analyzer open to complete the next exercise.
To test for improved query performance
- In the SQL Profiler, click File, point to Open, and then click Trace File.
The Open window appears and the Folder And File pane lists Trace01.
- Double-click Trace01.
Trace01 appears in the SQL Profiler window.
- Click Window and then click Tile Horizontally.
Trace01 and Trace02 are rearranged in the SQL Profiler window.
- Scroll down in both trace file displays until you see all of the CPU values.
Notice that Trace02 shows significantly less CPU consumption for the query than Trace01. Consider adding the Duration event class to the trace template to determine how long each SQL statement takes to execute.
- Close the SQL Profiler and the Query Analyzer.
Lesson Summary
Database optimization occurs during the design process and after implementation through tuning. At the conclusion of the design and implementation process, a performance baseline should be created using SQL Profiler and System Monitor. The baseline provides the data you need to determine to what extent performance is improved through tuning. A way to improve query performance is by running the Index Tuning wizard and implementing index recommendations provided by the wizard. The wizard requires a workload to analyze. The workload is a trace or a Transact-SQL script. After the workload is analyzed, the Index Tuning wizard makes recommendations. You implement the recommendations immediately, schedule the changes for later, or create a script so that you can manually execute the recommended changes.
Server and database performance is improved through partitioning. There are many different ways to partition a database. Implement federated servers or clusters and split the database across member servers. After creating a federation of servers, create distributed partitioned views to obtain data from horizontally partitioned member tables. Add additional processors so that SQL Server divides the worker threads among the available processors. Add disks, controllers, and RAID arrays, and then split the database and log files among the disks.
EAN: 2147483647
Pages: 97