Lesson 1:Monitoring Databases with SQL Profiler
3 4
It is common for database performance to suffer as data requests and the loads placed on SQL Server change over time. A database maintains optimal performance levels through regular monitoring. Database monitoring is an important systems management task and the SQL Profiler, introduced in Chapter 13, is a key tool for completing this task. This lesson teaches you how to operate the SQL Profiler.
After this lesson, you will be able to:
- Describe tools commonly used to monitor SQL Server 2000.
- Use the SQL Profiler.
- Analyze captured SQL Profiler event data.
Estimated Lesson time: 25 minutes
SQL Server Monitoring
You will use data collected through SQL Server monitoring to determine if SQL Server is efficiently handling the workload or if the environment must be changed to handle the increased workload. Before you begin monitoring, you must determine your monitoring goals and choose an appropriate monitoring tool. Most monitoring tools capture data that you can analyze to determine which events should be monitored in the future. If the server and database environment is running efficiently, use the captured data to establish a performance baseline. Use the baseline against future captures to determine what, if anything, has changed. If the server or database is not running efficiently, use the captured data to determine how to improve performance. For example, by monitoring the response times for frequently used queries, you can determine whether changes to the query or indexes on the tables are necessary. If you are concerned about security, use the captured data to evaluate user activity; for example, you can monitor a specific database for the Transact-SQL commands users are attempting to run. If the server or database is not operating properly, use captured data to troubleshoot problems or debug application components such as stored procedures.
The primary tools for SQL Server monitoring are SQL Profiler and System Monitor (Performance Monitor in Windows NT 4.0). The primary tool for database monitoring is SQL Profiler. In SQL Server, other tools and features available for SQL Server monitoring include the following:
- Enterprise Manager
Monitoring features are found in the Current Activity node located below the Management node of the Enterprise Manager console tree.
- SQL Server error logs
- System stored procedures, like sp_who and sp_monitor
SQL Profiler uses a set of stored procedures to monitor an instance of SQL Server. You can create your own monitoring application that uses these stored procedures to monitor SQL Server. For a list of SQL Profiler stored procedures, see "Creating and Managing Traces and Templates" in SQL Server Books Online.
- Built-in functions
- Trace flags or the Show Server Trace option in Query Analyzer.
Use trace flags to temporarily configure server behavior and then diagnose performance problems or debug stored procedures.
- Simple Network Management Protocol (SNMP)
SQL Server includes Management Information Base (MIB) files that load into a Network Management System (NMS), such as HP OpenView, to monitor server and database activity.
- Windows Management Instrumentation (WMI) SQL Server Provider
This lesson explores SQL Profiler. Consult SQL Server Books Online, the Windows 2000 Server Resource Kit, and the WMI SQL Server Administration Provider (on the SQL Server installation CD-ROM) for information on using the other tools listed.
SQL Profiler
Use the SQL Profiler graphical tool to monitor server and database activities such as auditing logins and determining the worst performing queries. SQL Profiler logs data to a SQL Server table or a file. To enhance capture analysis, you can replay logged data. SQL Profiler tracks events, such as the start of a batch or a transaction.
Monitoring with SQL Profiler
SQL Profiler monitors server and database activity and categorizes the activity as events. Logged events are called traces. A trace to a file is called a trace file and a trace to a table is called a trace table. After tracing events, you can replay traces in SQL Profiler against an instance of SQL Server to rerun the saved events. If traces are too large, you can filter the data so that only a subset of the event data is collected. Monitoring too many events adds overhead to the server and the monitoring process and can cause the trace file or trace table to grow very large, especially when monitoring over a long period of time. Define the data in a trace by using a trace template.
SQL Profiler is useful for completing the following tasks:
- Monitoring SQL Server performance
- Debugging Transact-SQL statements and stored procedures
Use SQL Profiler to trace Transact-SQL statements and stored procedures during database development. Replay the trace to confirm that the code works properly and that it runs efficiently.
- Identifying slow-executing queries.
- Troubleshooting problems in SQL Server
To troubleshoot an event, capture it on a production system and then replay it on a test system. This approach is useful for thorough troubleshooting without interfering with user activity on the production system.
- Auditing server and database activity
The security administrator can review any of the audited events, including the success or failure of a login attempt and the success or failure of permission requests in accessing statements and objects. Chapter 13, "Designing and Administering SQL Server 2000 Security," explores these topics.
Choosing Events, Data Columns, and Filters
SQL Profiler groups event classes into 13 categories or collections, which appear in the Events tab of the Event Properties dialog box. For example, you can expand the Performance collection and select the Show Execution Plan event class to show a plan tree for any SQL Statement being executed. Clicking the Add button (Figure 14.1) moves the event class to the Selected Event Classes box. Any event classes appearing in this box define the events that are captured when SQL Profiler is running.
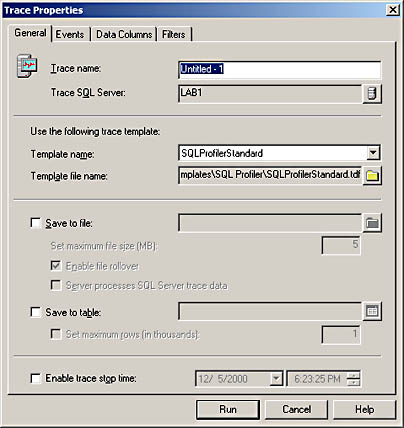
Figure 14.1 Adding the Execution Plan event class in the Performance Collection as a monitored event in SQL Profiler.
The Audit Login Event, Audit Logout Event, Existing Connection, RPC:Completed and SQL:BatchCompleted event classes appear in all SQL Profiler traces by default. You can remove any or all of these event classes or define templates that do not include these event classes. For a complete list of event collections and the event classes associated with each collection, see "Monitoring with SQL Profiler Event Categories" in SQL Server Books Online.
SQL Profiler contains a set of data columns that you select in the Data Columns tab of the Event Properties dialog box. Select columns based on the information you want returned and the way in which you want it returned when the trace is running. SQL Profiler displays the capture either in the order the events occur or sorted by group, based on one data column or a combination of data columns. If SQL Profiler can connect to the SQL Server where the trace data was captured, it will populate the Database ID, Object ID, and Index ID data columns with the names of the database, object, and index respectively. Otherwise, it will display identification numbers (IDs).
You can limit the amount of trace data captured by being selective about event classes and data columns in a trace. You can further restrict the amount of data captured by applying data filters in the Filters tab of the Event Properties dialog box. Filters serve to limit the events collected in the trace. For example, limiting the event capture to event failures will reduce the output data to only failed events. Event failures are configured in the Success event criteria.
SQL Profiler categorizes filters by event criteria. Each event criteria contains a set of operators appropriate to the criteria. For example, the TargetLoginName criteria contains the Like and Not Like operators and the Duration criteria contains Equals, Not Equal To, Greater Than or Equal, and Less Than or Equal operators.
Preparing to Run a Trace in SQL Profiler
Run SQL Profiler from the Microsoft SQL Server program group by clicking the Profiler icon or from the Enterprise Manager Tools menu by clicking SQL Profiler. When SQL Profiler opens, you are presented with an empty window. From this window, you must connect to an instance of SQL Server using a security account that has authentication privileges to SQL Server and EXECUTE permission for SQL Profiler stored procedures. You can connect by clicking the New Trace icon on the toolbar or from the File menu by pointing to New and then clicking Trace. Once connected, you are presented with a Trace Properties dialog box, as shown in Figure 14.2.
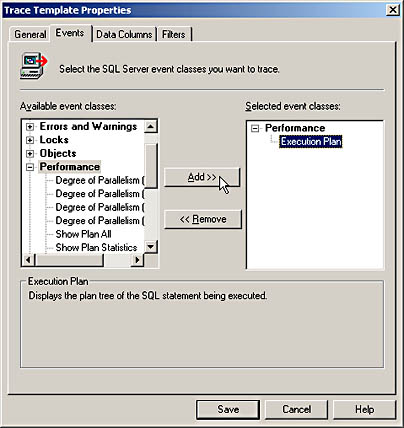
Figure 14.2 The Trace Properties dialog box, which is used to connect to the database and define a new trace.
From the Trace Properties dialog box, you name the trace, select the server (if it is different than the server you connected to originally), specify the trace template to use, choose a trace file or trace table for logging the events, and choose whether to automatically start and stop the trace. If you do not create a trace file or trace table, the trace appears only in SQL Profiler and is lost when SQL Profiler is closed. A trace file uses a .trc extension and if you choose the trace file option, you must specify a maximum file size, whether the file rollover feature is enabled, and whether SQL Server processes trace data. The file rollover feature instructs SQL Profiler to create a new file when the original trace file reaches its maximum size. The new file name will be the original .trc file name with a number appended to it. Enabling the Server Process SQL Server Trace Data checkbox instructs SQL Server to process trace data and to not skip any events defined in the template, even under stress conditions. If this checkbox is not checked, the client application processes trace data and may skip trace data processing under heavy stress conditions. The trace table feature instructs SQL Profiler to create a table in the database. The default database for table creation is the database that the authenticated user is configured to use upon establishing a connection with the server. SQL Profiler creates the table in the database automatically. You can restrict trace table growth by specifying maximum rows in thousands.
NOTE
There must be at least 10 MB of free space to run SQL Profiler. If free space drops below 10 MB, SQL Profiler will stop.
Using a Trace Template
A trace template defines the criteria (events, data columns, and filters) for each trace. The trace data captured is based upon the options specified in the template. SQL Profiler contains a number of pre-defined templates and you can define your own custom templates. A template uses a .tdf extension and is stored by default in the %Program Files%\Microsoft SQL Server\80\Tools\Templates\SQL Profiler folder. Figure 14.1 shows the SQL Profiler Standard predefined template whose file name is SQLProfilerStandard.tdf.
Controlling the Trace
After choosing the template and other options shown in Figure 14.1, click Run to start the trace. A two-pane window, showing the trace name and the server name, appears in SQL Profiler. The top pane in the trace window contains records and the data columns defined in the template. The bottom pane contains descriptive text about the record selected in the top pane. After starting a trace, you can modify the name of the trace or generate a SQL script containing the SQL Profiler stored procedures and other settings that SQL Profiler uses to capture the trace. The .sql file can then be used to create a .trc file from an application other than SQL Profiler, such as Query Analyzer.
In SQL Profiler you can pause or stop a trace from the toolbar or from the File menu. Pausing a trace prevents further event data from being captured until the trace is restarted. Restarting a trace resumes trace operations without losing previously captured data. Stopping a trace stops data from being captured. After a trace is stopped, it cannot be restarted without losing any previously captured data, unless the data has been captured to a trace file or trace table. All trace properties that were previously selected are preserved when a trace is stopped. When a trace is paused, you can change the name, events, columns, and filters but you cannot change the template used or the trace's target storage location. However, when a trace is stopped, you can change any trace properties, including the template used and the trace's target location.
Replaying a Trace
Replaying a trace is useful for debugging and includes common debugging features like single-step and breakpoint setting capabilities. There are specific event classes and data columns that must be captured to replay a trace. Use the SQLProfilerTSQL_Replay.tdf trace template to ensure that you are capturing all of the appropriate event classes and data columns to replay a trace.
Exercise 1: Capturing Events Using SQL Profiler

In this exercise, you will create a SQL Profiler template and then use that template to capture data to a trace file. The trace file will be loaded into the Index Tuning wizard in Exercise 2.
To create a SQL Profiler template
- Click Start, point to Programs, point to Microsoft SQL Server, and then click Profiler.
The SQL Profiler window appears.
- Click the File menu, point to New, and then click Trace Template.
The Trace Template Properties dialog box appears.
- In the General tab, click Save As.
The Save As window appears.
- In the Filename text box, type SQLProfiler_Exercise1 and click Save.
The file path and filename appear in the General tab.
- Click the Events tab.
- In the Available Event Classes box, scroll down and select TSQL and then click Add.
All Transact-sql event classes are added to the Selected Event Classes box.
- Click the Data Columns tab.
- In the Unselected Data box, scroll down and select the TextData column and click Add.
The TextData column appears in the Selected Data box.
- Click the Up button so TextData appears first in the column list.
- In the Selected Data box, click Groups.
- In the Unselected Data box, click CPU and then click Add.
The CPU column appears under Groups in the Selected Data box.
- Click the Filters tab.
- In the Trace Event Criteria box, expand ApplicationName.
The Like and Not Like criteria appear.
- Expand the Like criteria and in the empty text box that appears, type Query Analyzer.
- Click Save.
Leave SQL Profiler open to complete the next practice.
To prepare SQL Profiler to run a trace
- On the SQL Profiler toolbar, click the New Trace icon. New Trace is the first icon on the toolbar.
The Connect to SQL Server dialog box appears.
- Verify that the Windows Authentication radio button is selected, and click OK.
The Trace Properties dialog box appears and the General tab has the focus.
- In the Trace Name text box, type Trace01.
- In the Template Name drop-down list box select SQLProfiler_Exercise1.
- Click the Save To File check box.
The Save As window appears and Trace01 is the default filename.
- Click Save.
The trace file is saved to the My Documents folder and the Trace Properties dialog box reappears. Notice in the Trace Properties dialog box, that the maximum file size is set to 5 MB and that file rollover is enabled. The client processes the event data because the Server Processes SQL Server Trace Data is not checked.
- Click and review the settings displayed in the Events, Data Columns, and Filters tabs.
The settings in these tabs are identical to the template settings.
- Leave SQL Profiler open but do not click Run on the Trace Properties dialog box.
To generate SQL Server activity and run a trace
- Open Query Analyzer, and connect to your local server.
- In the Editor pane of the Query window, enter and execute the following code:
USE bookshopdb IF EXISTS (SELECT name from dbo.sysobjects where name = 'table01' AND type = 'U') DROP TABLE table01 CREATE TABLE table01 (uniqueID int IDENTITY, longcol02 char(300) DEFAULT 'This is the default value for this column', col03 char(1)) GO DECLARE @counter int SET @counter = 1 WHILE @counter <= 5000 BEGIN INSERT table01 (col03) VALUES ('a') INSERT table01 (col03) VALUES ('b') INSERT table01 (col03) VALUES ('c') INSERT table01 (col03) VALUES ('d') INSERT table01 (col03) VALUES ('e') SET @counter = @counter + 1 END The first part of the code checks for a table named Table01 in the BookShopDB database. If a table with this name is found, it is dropped. Then, the table is re-created with three columns and the table is populated with 5000 rows of data. Inserting rows into the table will take a few moments.
- In the Editor pane of the Query window, enter but do not execute the following code:
SELECT col03, longcol02 FROM table01 WHERE col03 = 'a' SELECT uniqueID, longcol02 FROM table01 WHERE uniqueID = 10000 SELECT * FROM table01 WHERE uniqueid BETWEEN 5000 AND 10000 GO
These Transact-SQL statements run queries against Table01. The SQL Profiler will trace the execution of this statement. Typically, you run SQL Profiler traces several times a day to gather a representative sample of database activity.
- Switch to the SQL Profiler window that you left open in the previous practice.
- In the Trace Properties dialog box, click Run.
The two-paned trace window appears and four data columns appear in the top pane.
- Switch to the Query Analyzer and run the SELECT statements entered in step 3 of this practice.
- Switch to the SQL Profiler and watch as the trace captures the Transact-SQL activity.
Trace data appears in the top pane of the trace window.
- When a record containing SQL:BatchCompleted in the EventClass column appears, click the red square on the toolbar to stop the trace.
An additional row is added to the top pane of the trace window, indicating that the trace stopped. Notice that the CPU data column appears only for SQL:StmtCompleted and SQL:BatchCompleted event classes. The CPU data column is not available or relevant to the other event classes. Also notice that the event classes with CPU values are grouped together.
To analyze the trace data
- The statements are grouped by CPU time. The CPU time shows the amount of CPU time, in milliseconds, used by the event.
- Click each of the rows containing a value in the CPU column.
The text data for each Transact-SQL event appears in the bottom pane.
- Which statement in the batch required the most CPU time to execute?
- Which event required the most CPU time? Explain your answer.
- Switch to Query Analyzer and insert the GO command between each SELECT statement. The code should now look like this:
SELECT col03, longcol02 FROM table01 WHERE col03 = 'a' GO SELECT uniqueID, longcol02 FROM table01 WHERE uniqueID = 10000 GO SELECT * FROM table01 WHERE uniqueid BETWEEN 5000 AND 10000 GO
- Switch to the SQL Profiler and restart the trace.
- Switch to the Query Analyzer and execute the code you modified in step 5 of this practice.
- Switch back to SQL Profiler and examine how the positioning of the GO command changed the output of the trace.
- When the query is finished, stop the trace.
- How does the trace output differ from the trace you created in the previous practice?
- Close SQL Profiler and Query Analyzer.
Lesson Summary
There are a number of tools designed to monitor SQL Server. SQL Profiler is the primary tool for monitoring SQL Server activity. Enterprise Manager, SQL Server error logs, system stored procedures, built-in functions, trace flags, SNMP, and WMI are other ways to monitor SQL Server activity.
SQL Profiler is a graphical tool that uses SQL Profiler stored procedures to trace SQL Server activity. The trace configuration can be defined in a trace template and the trace data is saved in a trace file or a trace table. SQL Server activity is grouped by event categories or collections. Each collection contains event classes. The event classes define the actual events that can be traced. To limit trace data, carefully select event classes and data columns for a trace. Use filters to further define the trace output you desire.
EAN: 2147483647
Pages: 97
- Challenging the Unpredictable: Changeable Order Management Systems
- ERP System Acquisition: A Process Model and Results From an Austrian Survey
- Context Management of ERP Processes in Virtual Communities
- Distributed Data Warehouse for Geo-spatial Services
- A Hybrid Clustering Technique to Improve Patient Data Quality