Lesson 2: Tools for Monitoring SQL Server
SQL Server includes several tools for monitoring the performance of your server. This lesson presents these tools and shows the different kinds of monitoring possible with SQL Server. You will learn how to monitor your SQL Server using the SQL Server Performance Monitor (Windows NT Performance Monitor), Transact-SQL statements, SQL Server Profiler, SQL Server Query Analyzer, and Current Activity in SQL Server Enterprise Manager.
After this lesson, you will be able to
- Describe what you can monitor in SQL Server
- Monitor hardware performance with Microsoft Windows NT Performance Monitor
- Use Transact-SQL tools to monitor performance
- Monitor SQL Server activity with SQL Server Profiler
- Enable the query history and view the last 100 SQL Server events in SQL Server Profiler
- Examine specific query performance in SQL Server Query Analyzer
- Examine process and lock Current Activity information in SQL Server Enterprise Manager
Estimated lesson time: 90 minutes
Common Monitoring Tasks
SQL Server provides several tools that you can use to examine different aspects of performance. These tools show varying degrees of detail to help you isolate problem areas. Your goal should be to determine the factor that is having the greatest negative impact on performance.
This limiting factor, also called a bottleneck, could be outside the realm of SQL Server—such as a hardware problem—or within the SQL Server data files, such as whether tables require specific indexes to produce faster queries. Often, isolating the bottleneck involves several iterations of this monitoring process.
System-Level Monitoring
As you evaluate your system, first look at the highest level to ensure that you have sufficient hardware to handle the requirements of the tasks you need to perform. For this level of monitoring, use
- Windows NT Event Viewer
- SQL Server Performance Monitor
SQL Server-Specific Monitoring
Next, monitor the SQL Server-specific areas. Look at the SQL Server activity and the consistency of the data.
SQL Server Activity
Monitor the amount of locking and contention, user connections, and tempdb use. For this level of monitoring, use
- SQL Server Profiler
- Current Activity in SQL Server Enterprise Manager
- System stored procedures
- Transact-SQL statements
Consistency of Data
To ensure that the internal data structures are correct, use DBCC statements.
Specific Query Performance
Finally, examine specific queries to evaluate their performance. Items to review include index usage, CPU time for a query, and actual I/O. For this detailed level of monitoring, use
- SQL Server Profiler
- SQL Server Query Analyzer
- The Index Query Wizard
Using the Windows NT Event Viewer
You can use the Windows NT Event Viewer to identify events that may be causing performance bottlenecks. This information can help you determine which events or areas of performance you want to examine further.
The Windows NT Event Viewer allows you to look at the event logs listed in the following table. Events that interrupt or hinder system performance are written to these logs. Some log messages that you might watch for include notification that a log file is full, that a file is bad, or that an application error (raised as part of a stored procedure) has occurred.
The Windows NT application log also captures informational messages about events, including startup, recovery, shutdown, and alerts. To help you locate pertinent information, you can filter the error messages by type.
All SQL Server messages are also logged to the SQL Server error log, which you can view in SQL Server Enterprise Manager.
| Type | Description |
|---|---|
| Windows NT application log | Records events logged by applications, such as SQL Server. For example, a database application might record a file error in the application log. |
| Windows NT system log | Records events that the Windows NT system components log. For example, the failure of a driver or other system component to load during startup is recorded in the system log. |
| Windows NT security log | Records security events. For example, attempts to log on to the system are recorded here. |
Using SQL Server Performance Monitor
When you want to track activity information and performance statistics for your server, use SQL Server Performance Monitor. You can use SQL Server Performance Monitor to log performance over time or to observe server activity as it happens.
SQL Server-Specific Counters in Windows NT Performance Monitor
SQL Server Performance Monitor is actually the Windows NT Performance Monitor. A number of Performance Monitor objects and counters for monitoring SQL Server-specific metrics are added at installation. The Performance Monitor item within the Microsoft SQL Server 7.0 program group simply launches Windows NT Performance Monitor, using a predefined set of these counters that are saved in the Sqlctrs.pmc file. This set of counters is a small subset of the available counters. There are 16 objects and more than 100 counters available. You can change the counters and save the Sqlctrs.pmc file or create your own .PMC files to launch Performance Monitor with your own predefined sets of counters.
As with all performance monitoring tools, you should expect some performance overhead when you monitor SQL Server with SQL Server Performance Monitor. The fewer counters you monitor at any time, the lower the overhead of using Performance Monitor.
NOTE
The Performance Monitor is not available for SQL Server running on Windows 95 or Windows 98. Clients running on Windows 95 or Windows 98 cannot monitor Performance Monitor counters on a Windows NT_based SQL Server.
Appropriate Security
If the server is using Windows NT authentication, only a member of the System Administrators (sysadmin) role can use SQL Server Performance Monitor.
Counters to Monitor
Standard Windows NT counters and the SQL Server counters provide valuable information about the performance of SQL Server.
Predefined Counters
When you start SQL Server Performance Monitor, it monitors a predefined set of SQL Server counters, defined in the Sqlctrs.pmc file. This file is loaded automatically when you start SQL Server Performance Monitor. The predefined counters and a brief description of each are given in the following table.
| Object / Counter | Description |
|---|---|
| SQLServer:Buffer Manager / Buffer Cache Hit Ratio | Percentage of pages that were found in the buffer cache without having to incur a read from disk. |
| SQLServer:General Statistics / User Connections | Number of users connected to the server. |
| SQLServer:Memory Manager / Total Server Memory (KB) | Total amount of dynamic memory that the server is currently using. |
| SQLServer:SQL Statistics / SQL Compilations/sec | Total SQL compilations (including recompilations) per second. |
| SQLServer:Buffer Manager / Page Reads/sec | Number of physical database page reads issued per second. |
| SQLServer:Buffer Manager / Page Writes/sec | Number of physical database page writes issued per second. |
SQL Server Counters
The following table contains additional SQL Server counters that are useful in monitoring the server.
| Object / Counter | Description |
|---|---|
| SQLServer:Buffer Manager / Free Buffers | Number of free buffers available. |
| SQLServer:Databases / Active Transactions | Number of active transactions for a given database. |
| SQLServer:Databases / Percent Log Used | Percentage of log space in use for a given database. |
| SQLServer:Access Methods / Full Scans/sec | Number of unrestricted full scans per second. These can be either base table or full index scans. |
| SQLServer:Access Methods / Index Searches/sec | Number of index searches per second. These are used to start range scans, fetch single index records, and reposition nodes in an index. |
| SQLServer:Locks / Number of Deadlocks/sec | Number of lock requests per second that resulted in a deadlock. |
Windows NT Counters
The following table describes some of the more important Windows NT counters to monitor.
| Object / Counter | Description |
|---|---|
| Memory / Pages/sec | Number of pages read from or written to the page file per second to resolve memory references to pages that were not in memory at the time of the reference. An increase in this figure may indicate a RAM shortage. |
| Memory / Page Faults/sec | Number of page faults per second. An increase in this figure may indicate a RAM shortage. |
| Process / Page Faults/sec (sqlservr instance) | Number of page faults caused by SQL Server per second. An increase in this figure indicates that SQL Server is not getting enough RAM. |
| Processor / % Processor Time | Percentage of elapsed time the CPU was busy (non-idle time). |
| Process / % Processor Time (sqlservr instance) | Percentage of elapsed time the CPU was busy with SQL Server work. |
| PhysicalDisk / % Disk Time | Percentage of elapsed time the disk was busy with read/write activity. |
| PhysicalDisk / Avg. Disk Queue Length | Number of system requests waiting for disk access. Should not be more than 1.5 to 2 per physical disk. |
IMPORTANT
In order to use the counters of the PhysicalDisk object, you must enable them using the Windows NT diskperf command. These counters are disabled by default, as monitoring disk activity can cause increased disk access times. See the Windows NT documentation for more information.
User-Defined Counters
You can also create up to ten user-defined counters. The SQLServer:User Settable object provides the Query counter, which has 10 instances: User counter 1 through 10. You can provide values for these counters by calling the system stored procedures sp_user_counter1 through sp_user_counter10 and passing them the value you wish to monitor. A counter can monitor information that is returned by a SQL statement or by any operation that returns a value, such as the execution of a stored procedure.
Practice: Monitoring SQL Server Activity with SQL Server Performance Monitor
In this practice, you will set up your system to monitor SQL Server activity with the SQL Server Performance Monitor.
Exercise 1: Setting Up Stress Files
In this exercise, you will set up stress files. To set up the stress files
- Create a new folder called C:\Monitor.
- Copy the files from C:\Sqladmin\Exercise\Ch14\Monitor, installed on your hard disk drive from the Supplemental Course Materials CD-ROM, to the new folder.
Exercise 2: Creating the nwcopy Database
In this exercise, you will restore a backup of the nwcopy database to add it to your server.
- To create the nwcopy database
- Log on to your computer as Administrator or another account that is a member of the Administrators local group.
- Copy the C:\Sqladmin\Exercise\Ch10\Nwc1.bak file to C:\Mssql7\Backup on your local hard disk.
- Open SQL Server Query Analyzer and log on to the (local) server with Microsoft Windows NT authentication. Your account is a member of the Windows NT Administrators group, which is automatically mapped to the SQL Server sysadmin role.
- Open C:\Sqladmin\Exercise\Ch14\Setupnwc.sql, and then review and execute it.
This script restores the nwcopy database that is used in the exercises that follow.
Exercise 3: Configuring the Windows NT Performance Monitor
In this exercise, you will add Performance Monitor counters to monitor SQL Server activity.
- To configure Windows NT Performance Monitor
- Start Windows NT Performance Monitor.
- Open the C:\Sqladmin\Exercise\Ch14\Monlab.pmc file and skip the rest of this exercise, or continue with step 3 to add the counters yourself.
- On the toolbar, click Add Counter (+). The Add To Chart dialog box appears.
- Add counters using the information in the following table. Click Add after each counter is configured. Click Done when you have added all of the counters.
| Object | Counter | Instance |
|---|---|---|
| SQLServer:Buffer Manager | Buffer Cache Hit Ratio | |
| SQLServer:SQL Statistics | Batch Requests/sec | |
| SQLServer:Access Methods | Full Scans/sec | |
| SQLServer:Access Methods | Index Searches/sec | |
| SQLServer:Databases | Percent Log Used | Nwcopy |
| SQLServer:Memory Manager | Lock Blocks |
Exercise 4: Simulating Server Activity
In this exercise, you will execute a batch file to simulate server activity. This batch file creates several command-prompt sessions that interact with SQL Server.
- To simulate server activity
- Stop and restart SQL Server.
- At a command prompt, change to the C:\Monitor folder, and execute the Monitor.bat batch file. This file opens seven command-prompt windows.
- Switch to the SQL Server Performance Monitor window.
Watch the Chart window while the monitoring batch files execute. What trends do you notice?
Answer
Exercise 5: Adding Counters to the Chart
In this exercise, you will add counters to the chart in order to observe the response of various counters.
- To add counters to the chart
- On the toolbar, click Add Counter (+). The Add To Chart dialog box appears.
- Add counters, using the information in the following table. Click Add after each counter is configured. Click Done when you have added all of the counters.
- Watch the Chart window while the monitoring batch files continue to execute. (Press Ctrl-H to highlight the currently selected counter.)
- Close each command-prompt window. The Windows NT Performance Monitor counters should reflect the lack of activity on the server.
- Exit Windows NT Performance Monitor.
| Object | Counter | Instance |
|---|---|---|
| Memory | Page Faults/sec | |
| Memory | Pages/sec | |
| Process | % Processor Time | sqlservr |
| Process | Page Faults/sec | sqlservr |
What trends do you notice?
Answer
Using Transact-SQL to Monitor SQL Server
In addition to the graphical tools, you can use several Transact-SQL statements to monitor SQL Server.
System Stored Procedures
Use the system stored procedures in the following table to see real-time information or statistics about your database or server.
| System stored procedure | Reports information on |
|---|---|
| sp_who | Current SQL Server users and processes |
| sp_lock | Active locks |
| sp_spaceused | The amount of disk space used by a table or by the entire database |
| sp_helpdb | Databases and their objects |
| sp_monitor | Overall SQL Server statistics |
| sp_helpindex | Indexes on a table |
Functions
The next table lists some of the functions that you can use to obtain specific statistics or information. See Books Online for many more functions.
NOTE
In previous versions of SQL Server, functions that had names beginning with @@ were called global variables. Global variables in SQL Server 7 refer to variables that can be referenced by multiple Data Transformation Services tasks.
| Function | Purpose |
|---|---|
| @@CONNECTIONS | Returns the number of connections or attempted connections since SQL Server was last started. |
| @@CPU_BUSY | Returns the time in milliseconds that the CPU has spent doing work since SQL Server was last started. |
| @@IO_BUSY | Returns the time in milliseconds that SQL Server has spent doing input and output operations since it was last started. |
| @@IDLE | Returns the time in milliseconds that SQL Server has been idle since it was last started. |
| @@TOTAL_ERRORS | Returns the number of disk read/write errors encountered by SQL Server since it was last started. |
| @@PACKET_ERRORS | Returns the number of network packet errors that have occurred on SQL Server connections since it was last started. |
Transact-SQL SET Statements
The Transact-SQL programming language provides several SET statements that alter the current session handling of specific information. The following table lists some of the Transact-SQL SET statements you can use to show statistics or display a text-based query execution plan.
| SET statement | Purpose |
|---|---|
| SET STATISTICS IO | Causes SQL Server to display information regarding the amount of disk activity generated by Transact-SQL statements. |
| SET STATISTICS TIME | Causes SQL Server to display the number of milliseconds required to parse, compile, and execute each statement. |
| SET SHOWPLAN_TEXT | Causes SQL Server not to execute Transact-SQL statements. Instead, SQL Server returns detailed information about how the statements are executed. |
DBCC Statements
You can use DBCC statements to check performance and activity, as well as the logical and physical consistency of a database.
Some DBCC statements that you might use to monitor performance are listed in the following table.
| DBCC statement | Reports information on |
|---|---|
| SQLPERF(LOGSPACE) | Transaction log space usage in all databases |
| OPENTRAN | The oldest active transaction in a specified database |
| SHOW_STATISTICS | The selectivity of an index, which provides the basis for determining whether an index is useful to the optimizer |
| SHOW_CONTIG | Fragmentation of data and indexes of a table |
| CHECKDB | The allocation and structural integrity of all objects in a database |
| CHECKFILEGROUP | The allocation and structural integrity of all tables in a filegroup |
| CHECKALLOC | The allocation and use of all pages in a database |
| CHECKTABLE | The integrity of the data, index, text, ntext, and image pages for a table |
NOTE
In previous versions of SQL Server, the DBCC MEMUSAGE, DBCC SQLPERF, and DBCC PERFMON statements were used to show various SQL Server performance statistics. These DBCC statements are still available but are no longer documented. In SQL Server 7, use the Performance Monitor to monitor instead.
Trace Flags
You can use trace flags to set specific server characteristics, but you also can use them to diagnose performance issues and debug queries and system stored procedures. You set the trace flags with the DBCC TRACEON statement and disable traces with the DBCC TRACEOFF statement.
The following table lists some of the trace flags you can use to monitor your server.
| Trace flag | Description |
|---|---|
| 325 | Prints information about the cost of using a nonclustered index or a sort to process an ORDER BY clause. |
| 326 | Prints information about the estimated and actual cost of sorts. |
| 330 | Enables full output when you use the SET SHOWPLAN option, which gives detailed information about joins. |
| 1204 | Returns the type of locks that are participating in a deadlock and the current statement that is affected. |
| 1205 | Returns more detailed information about the statement being executed at the time of a deadlock. |
| 1704 | Prints information when a temporary table is created or dropped. |
| 3604 | Sends trace output to the client—used only when setting trace flags with the DBCC TRACEON and DBCC TRACEOFF statements. |
| 3605 | Sends trace output to the error log. If you start SQL Server from the command prompt, the output also appears on the screen. |
| 8501 | Performs detailed logging that describes all Microsoft Distributed Transaction Coordinator (MS DTC)—related context and state changes. |
NOTE
For many of the trace flags, the extra output is seen only by starting SQL Server from the command prompt or by sending the trace flag output to the error log by turning on trace flag 3605.Use trace flags with care. You can get unpredictable results if you use undocumented trace flags. The use of trace flags is generally not supported by Microsoft.
Using SQL Server Profiler
SQL Server Profiler provides you with the ability to monitor server and database activity, including login, user, and application activity. You can also capture the data to a table, file, or SQL script for later analysis.
NOTE
In previous versions of SQL Server, Profiler was called SQL Trace. SQL Server Profiler can read trace files saved in SQL Trace.
Monitoring Current Server Activity
To use SQL Server Profiler, first decide what you want to monitor, and then choose criteria to monitor. Traces can be public—available to all users of the computer—or private, available only to the user who defined the trace.
You can capture information about a wide assortment of events and then filter and group the information meaningfully so that only significant data is captured. Some events that you might want to monitor include
- Poorly performing queries
- Queries that cause table scans
- Activities of individual users or applications
- Deadlock problems
- Login attempts, failures, connections, and disconnections
- Logical disk reads and physical writes
- CPU use at the statement level
- Error severity levels
- Wait time for all post-execution events
Capturing Real-Time Results
You can monitor the results of server activity and see commands being processed at the server in real time.
Capturing Data to a File
Saving trace information allows you to
- Replay the activity against a server
- Analyze and perform additional filtering of the event activity
- Provide a load file for use with the Index Tuning Wizard
- Step through and execute SQL batches and stored procedures to debug an application
Using the Index Tuning Wizard
The Index Tuning Wizard allows you to select and create an optimal set of indexes and statistics for a SQL Server database without requiring an expert understanding of the structure of the database, the workload, or the internals of SQL Server. You can launch the Index Tuning Wizard from SQL Server Profiler or SQL Server Enterprise Manager.
To build a recommendation of the optimal set of indexes that should be in place, the wizard requires a workload. A workload consists of a SQL script or a SQL Server Profiler trace.
Exercise: Configuring SQL Server Profiler
You suspect that users are submitting queries that take a long time to execute and that unauthorized users are trying to gain access to your SQL Server. In this exercise, you will create a trace to detect long-running queries and events, record query activity, and organize the output by duration.
- To configure SQL Server Profiler
- Start SQL Server Profiler.
- On the File menu, select New, then click Trace to create a new trace. Use the information in the following table to set options on the General tab of the Trace Properties dialog box.
- On the Events tab, define the trace to monitor the events in the next table. (To add an event to the Selected Events list, expand the event category in the Available events lists, select the required event, and click Add>>.)
- Click the Data Columns tab.
- Use the Add>> and <<Remove buttons to move the data column names between the Unselected Data and Selected Data lists so that you have the data column names listed in the following table in the Selected Data list.
- Click OK to start the trace.
| Option | Value |
|---|---|
| Trace Name | LongQueries |
| Trace Type | Private |
| SQL Server | SQLServer (or your server name if different) |
| Capture To File | Checked. C:\Sqladmin\Exercise\Ch14\Monitor\LongQueries.trc |
| Event category | Selected events |
|---|---|
| TSQL | RPC:Completed |
| TSQL | SQL:BatchCompleted |
| Sessions | Connect |
| Sessions | Disconnect |
| Sessions | ExistingConnection |
| Misc. | Login Failed |
Use the Up and Down buttons to order the data columns in the Selected Data list. In particular, ensure that Duration is the only data column in the Groups category. This will cause the trace output to be grouped by event duration.
| Data column | Category |
|---|---|
| Duration | Groups |
| Event Class | Columns |
| Text | Columns |
| Application Name | Columns |
| NT User Name | Columns |
| CPU | Columns |
| Reads | Columns |
| Writes | Columns |
| Integer Data | Columns |
Exercise: Detecting Login Attempts
In this exercise, you will monitor an unauthorized login attempt. To do this, you will attempt to log on with an invalid account, and then you will review the SQL Server Profiler.
- To detect login attempts
- Start SQL Server Query Analyzer.
- Try to connect to SQL Server with SQL Server authentication, the login account Maria, and no password.
- Try to connect to SQL Server with SQL Server authentication, the sa login account, and an incorrect password.
- Switch to the SQL Server Profiler window.
- Expand the node labeled Duration = 0.
- Connect to SQL Server with the sa login account and a correct password.
- Switch to the SQL Server Profiler window, and expand all nodes on the tree.
What information is recorded?
Answer
What information is recorded?
Answer
Exercise: Editing the Current Trace
In this exercise, you will edit the current trace by setting up a filter to show only events longer than 100 milliseconds in duration.
- To edit the current trace
- Stop the active trace.
- On the Edit menu, click Clear Trace Window.
- On the main window toolbar, click Edit Trace Properties.
- On the Events tab, remove the LoginFailed event from the trace.
- Click the Filters tab.
- In the Trace Event Criteria list, click Duration.
- Enter 100 in Minimum. This filters out all events that have a duration of less than 100 milliseconds.
- Start the trace.
Exercise: Detecting Long-Running Queries
In this exercise, you will use the current trace to detect the longest-running queries in a batch of SQL statements.
- To detect long-running queries
- Open a command-prompt window.
- Simulate server activity by executing the C:\Sqladmin\Exercise\Ch14\Monitor\LongQry.bat batch file. This executes several queries on tables in the nwcopy database.
- Switch to SQL Server Profiler.
- Expand Duration for each event, and examine the events with long run times.
- Locate the SELECT statement with the longest duration.
- Expand SQL:BatchCompleted to see the text of the query.
- Stop the trace and close SQL Server Profiler.
What events are included?
Answer
What is the query text?
Answer
Using the Query History
The query history is a trace of the last 100 events in SQL Server, which uses the extended stored procedures of the SQL Server Profiler. You can use the query history to troubleshoot serious SQL Server failures and when reporting failures to your primary support provider.
Enabling the query history has little impact on SQL Server performance.
Determine the Cause of a Disaster
The 100 most recent events are automatically recorded in the Blackbox.trc trace file in the C:\Mssql7\Log folder if an exception of severity 17 or higher occurs. By using the information in the query history trace file, you can step through the events just prior to a server crash and examine the ones that resulted in errors.
Activate Query History with xp_trace_setqueryhistory
To enable the query history, execute the xp_trace_setqueryhistory extended stored procedure. The syntax for this procedure is as follows:
EXECUTE xp_trace_setqueryhistory (0 | 1) |
This example enables the query history.
EXECUTE xp_trace_setqueryhistory 1 |
Write to Disk with xp_trace_flushqueryhistory
To write the current contents of the query history to a trace file, execute the xp_trace_flushqueryhistory extended stored procedure. The syntax for this procedure is as follows:
EXECUTE xp_trace_flushqueryhistory 'filename' |
This example writes the query history to a file called C:\Mssql7\Log\Qhist.trc.
EXECUTE xp_trace_flushqueryhistory 'c:\mssql7\log\qhist.trc' |
View the File with SQL Server Profiler
You can use SQL Server Profiler to open the Blackbox.trc or trace files saved with xp_trace_flushqueryhistory. The trace file displays detailed information about the 100 events that occurred immediately prior to the file being saved, including the event class, Transact-SQL text that was executed, the client that is responsible for the event, the user, and the server name. It also shows any relevant error messages. SQL Server does not have to be running to view the file in SQL Server Profiler.
Exercise: Starting the Query History
In this exercise, you will use a system stored procedure to start the query history and capture recent SQL Server activity.
- To start the query history
- Open SQL Server Query Analyzer and connect with Windows NT authentication.
- Ensure that master is selected in the DB list box. If master is not the current database, the following step will fail.
- Type and execute the following Transact-SQL statement:
EXEC xp_trace_setqueryhistory 1 |
Exercise: Simulating User Activity and Flushing the Query History
In this exercise, you will execute a batch file that simulates user activity and then shuts down the server.
- To simulate user activity and flush the query history
- In SQL Server Query Analyzer, open the C:\Sqladmin\Exercise\Ch14\ Activity.sql script file. Execute the script to generate activity on the server.
- Type and execute the following Transact-SQL statement to flush the query history to a file:
- Type and execute the following Transact-SQL statement to stop the query history:
EXEC xp_trace_flushqueryhistory 'C:\Sqladmin\Exercise\Ch14\QryHist.trc' |
EXEC xp_trace_setqueryhistory 0 |
Exercise: Viewing the Contents of the Trace File
In this exercise, you will use SQL Server Profiler to examine the contents of the query history trace file.
- To view the contents of the QryHist.trc file
- In SQL Server Profiler, on the File menu, point to Open and then click Trace File. Navigate to the C:\Sqladmin\Exercise\Ch14\QryHist.trc trace file and open it. The file may take a while to open.
- Examine the trace.
Using SQL Server Query Analyzer
You can use SQL Server Query Analyzer as a monitoring tool to collect information on a specific query.
Displaying a Graphical Plan of Execution
When you select Show Execution Plan on the Query menu in SQL Server Query Analyzer, the analyzer visually displays the plan of execution in the Execution Plan tab of the results pane when you execute a command batch, as shown in Figure 14.2. You can also use Display Estimated Execution Plan on the Query menu to see an estimation of the query plan without actually executing the command batch. Each icon in the plan represents a step in the query process. The execution plan provides detailed information, including
- Which indexes are used
- The types of access methods (such as table scans) that are performed
- Approximate or actual I/O work
- The estimated or actual CPU time required to complete the query
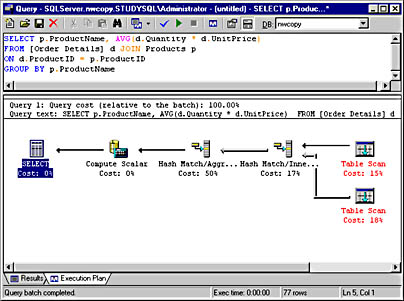
Figure 14.2 The graphical execution plan in SQL Server Query Analyzer
Using the Index Analysis Tool
SQL Server Query Analyzer provides a utility to recommend indexes for a particular query. The Index Analysis tool suggests indexes that will optimize a query and generates the Transact-SQL statements required to create the indexes. Select Perform Index Analysis from the Query menu to run the Index Analysis tool.
Exercise: Generating Performance Statistics and an Execution Plan
In this exercise, you will use SQL Server Query Analyzer to generate performance statistics as well as an execution plan for a long-running query.
- To execute a query and generate an execution plan and statistics
- Open SQL Server Query Analyzer and connect to SQL Server with Windows NT authentication..
- In the DB list box, click nwcopy.
- Type the following query, which was previously identified as a long-running query, into the query window:
- On the Query menu, click Show Execution Plan. This enables the graphical query output, which you will see when you execute the query later.
- On the Query menu, click Current Connection Options.
- Check the Show Stats Time option and the Show Stats I/O option. Click OK to close the dialog box and save your changes.
- Execute the query.
- Scroll to the end of the query result set on the Results tab, and record the count of logical reads for each table.
- Click the Execution Plan tab to display the graphical execution plan for this query. Note that statistics about each step are given if you move your mouse pointer over the step icons. The Table Scan steps may show a message stating that statistics are missing for the table. This is correct because the tables in nwcopy do not have indexes or statistics created for them.
- Open another query window, and make sure that nwcopy is selected in the DB list box.
- Execute the following queries:
SELECT e.lastname, p.productname, avg(d.quantity * d.unitprice) FROM employees e JOIN orders o ON e.employeeID = o.employeeid JOIN [order details] d ON o.orderid = d.orderid JOIN products p ON d.productid = p.productid GROUP BY e.lastname, p.productname |
Were table scans used to process this query? What can be done to improve performance?
Answer
EXEC sp_helpindex Employees EXEC sp_helpindex Orders EXEC sp_helpindex [Order Details] EXEC sp_helpindex Products |
What indexes exist on the Employees, Orders, Order Details, and Products tables?
Answer
Using Current Activity in SQL Server Enterprise Manager
Current Activity in SQL Server Enterprise Manager displays
- Information about current user connections and locks
- The process number, status, locks, and last TSQL command for active users
- Information about objects that are locked and the kinds of locks that are present
SQL Server Processes
Current Activity in SQL Server Enterprise Manager displays information about current processes. There are a number of system processes, as well as one process for each user connection. Many of the processes will be inactive, awaiting a command. The information displayed includes
- Process ID
- Username
- Current database
- Client application name
- CPU utilization
- Physical I/O utilization
- Memory utilization
- Login time
- Time of last command batch run
- Client network library
- Client network address
- Process ID of any process blocking this process
- Process ID of any process being blocked by this process
Locks
Current Activity in SQL Server Enterprise Manager also displays information about locks acquired and held on objects by processes. Two views of locking are available:
- Locks / Process ID lists locks by process ID. This view highlights processes that are blocked by or are blocking other processes.
- Locks / Object lists locks by object.
To prevent simultaneous transactions from interfering with one another (concurrency control), SQL Server places locks on the relevant tables or data pages. The type of lock depends on the type and size of operation being performed.
Exclusive locks are applied for the UPDATE, INSERT, and DELETE data modification operations. Exclusive locks are always held until the end of the transaction, blocking additional users from reading or modifying the data. Shared locks are applied for read operations, allowing other users to read but not modify the data. Shared locks are usually held only for the duration of the read operation; however, the HOLDLOCK keyword holds the shared lock until the end of the transaction.
Blocking
A transaction waiting for a lock on an object is said to be blocked. SQL Server transactions do not time out when they are blocked unless you specify a value for the LOCK_TIMEOUT setting. Blocking is normal and is necessary to prevent transactions from overwriting one another. Do not confuse blocking with deadlock. Optimizing applications and database design to minimize blocking is one of the ways to ensure good overall system performance.
Deadlock
A deadlock occurs when two users (or sessions) have locks on separate objects and each user wants a lock on the other's object. Each user waits for the other to release its lock, but because they are waiting for each other, they will wait indefinitely. Meanwhile, other users cannot lock either of the objects involved in the deadlock, and system performance degrades.
Figure 14.3 shows two transactions involved in a deadlock. Transaction 1 has a lock on Table A and is waiting to obtain a lock on Table B. Transaction 2 has a lock on Table B and is waiting to obtain a lock on Table A.
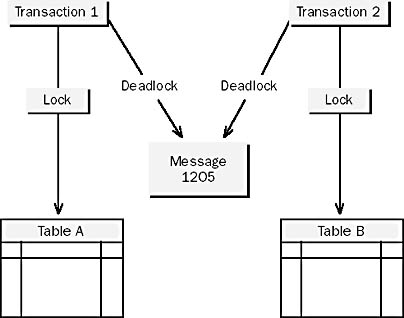
Figure 14-3 Two deadlocked transactions
SQL Server detects deadlocks and selects one of the transactions as a victim. It rolls back the deadlock victim's transaction, notifies the user's application (by returning error message number 1205), cancels the user's current request, and then allows the other transaction to continue.
Managing Processes and Locks
In addition to viewing information about selected processes, you can use Current Activity in SQL Server Enterprise Manager to send a message to a selected user or to terminate a selected process.
Practice: Managing Locks
In these exercises, you will open three query windows in SQL Server Query Analyzer, called connection 1, 2 and 3. You will then use the BEGIN TRANSACTION and ROLLBACK TRANSACTION statements to control how an UPDATE statement is processed on the member table. You will use system stored procedures and Current Activity in SQL Server Enterprise Manager to monitor the connections.
Exercise 1: Viewing Locking Information
In this exercise, you will use Current Activity to view locking information.
- To view locking information
- Open SQL Server Query Analyzer (connection 1), and select nwcopy in the DBlist box.
- Execute the following system stored procedures, using connection 1, and review the output:
- Do not close the connection 1 query window in SQL Server Query Analyzer; you will continue to use it in the next exercise.
- Start SQL Server Enterprise Manager. Expand your server, expand Management, and then expand Current Activity.
- Explore the Current Activity information by clicking Process Info, expanding Locks / Process ID, and clicking on a few processes and then expanding Locks / Object and clicking a few objects.
EXEC sp_who EXEC sp_lock |
NOTE
The information under Current Activity is not updated dynamically. To see updated information, you must periodically right-click Current Activity and then click Refresh.
Exercise 2: Holding Locks on Server Resources
In this exercise, you will execute SQL statements that obtain and hold locks on server resources. You will use system stored procedures, as well as SQL Server Enterprise Manager, to examine locking information. You will continue to use the connection 1 query window from the previous exercise and open a second query window called connection 2.
- To hold locks on the server
- Open a new query using SQL Server Query Analyzer (connection 2), and ensure that nwcopy is selected in the DB list.
- Open C:\Sqladmin\Exercise\Ch14\Lock.sql, using connection 2, and review its contents.
- Execute C:\Sqladmin\Exercise\Ch14\Lock.sql, using connection 2, and review the results.
- Switch to connection 1, execute the sp_lock system stored procedure, and then review the lock information.
- Switch to SQL Server Enterprise Manager, refresh Current Activity, and review the locking information.
Notice that a transaction is started with the BEGIN TRAN statement, but a corresponding COMMIT TRAN or ROLLBACK TRAN statement to complete the transaction does not exist. The absence of these statements keeps the transactions open and the associated locks active so that you can view locking information.
Record the server process ID (spid) for this connection.
Using the spid recorded in step 3, identify what locks were granted to the transaction that was issued by connection 2.
Answer
Exercise 3: Detecting Lock Blocking
In this exercise, you will create and observe a blocking situation in which one query must wait while another query uses a resource. You will continue to use the connection 1 and 2 query windows from the previous exercise and open a third query window called connection 3.
- To detect lock blocking
- Open a new query window using SQL Server Query Analyzer (connection 3), and ensure that nwcopy is selected in the DB list box.
- Open and execute C:\Sqladmin\Exercise\Ch14\Lock.sql, using connection 3.
- Switch to connection 1 and execute the sp_lock system stored procedure.
- Switch to SQL Server Enterprise Manager, refresh Current Activity, and review the locking information. In particular, note the information under Locks / Process ID.
- Switch to connection 2 in the Query Analyzer.
- Type ROLLBACK TRAN on a new line in the query pane, and highlight it. Now execute the statement. (Only the highlighted ROLLBACK TRAN statement is executed.)
- Switch to connection 1 and execute the sp_lock system stored procedure.
- Switch to connection 3 and complete the transaction by executing a ROLLBACK TRAN statement.
- Switch to SQL Server Enterprise Manager, refresh Current Activity, and review the locking information. Confirm that the exclusive and intent locks have been released.
- Close all SQL Server Query Analyzer connections.
Does the query complete?
Answer
Is the spid for connection 3 waiting for any resources? (Look for WAIT in the Status column.)
Answer
Why can't connection 3 complete the query?
Answer
You will see that the locks that were acquired by the transaction in connection 2 have now been released and connection 3 is no longer waiting.
Lesson Summary
SQL Server includes several tools for monitoring the performance of your server. The tools allow you to monitor the SQL Server computer, the overall SQL Server performance, and individual queries and database objects. The primary tools are the SQL Server Performance Monitor (Windows NT Performance Monitor), Transact-SQL statements, SQL Server Profiler, SQL Server Query Analyzer, and Current Activity in SQL Server Enterprise Manager.