Lesson 3: Designing and Building Cubes
After this lesson, you will be able to:
- Describe and build dimensions
- Build data cubes using the Cube wizard and the Cube Editor
Estimated lesson time: 45 minutes
Building Dimensions
Dimensions are the basis of cubes. They allow you to define how you want to view data. A dimension can be a single criterion by which we view data for example, by employee. Dimensions frequently represent a hierarchical view of the information in your fact table. For example,

Data cubes are based on dimensions. Using dimensions allows you to perform drill-down analysis, where you start at the highest level of the data and drill down to progressively lower, more detailed data.
For example,
- Product: How many units of product 72C were sold last year
- Time: Sales of 72C by quarter, by month, and by day
- Geography: Sales of product 72C by region
Private Dimensions versus Shared Dimensions
Shared dimensions are created independently of any particular cube. They are
- Stored in the OLAP Services database library
- Shared by one or more cubes
- Used to standardize certain business metrics to ensure consistency in numerous cubes
For example, the above Parent Company\Company\Division\ Department\Employee dimension would be a good candidate for a shared dimension. Those criteria and that hierarchy are likely to be used in many analyses of company data. Making them available to all cubes encourages standardization and helps makes comparisons across cubes meaningful.
Private dimensions are created within a cube. They are
- Defined when you define the cube
- Stored in the library of each cube
Use private dimensions when defining a way of looking at data that only makes sense in a given subject area. For example, the shipper dimension would be meaningful in a cube tracking customer activity, but it has little relevance in a cube analyzing employee sales figures.
The Dimension Wizard
The Dimension wizard provides a graphical user interface (GUI) to simplify the process of creating dimensions. If invoked independently, it can be used to create shared dimensions. If you are using the Cube wizard, the Dimension wizard can be called to create private dimensions.
Creating Calculated Members
You can create calculated members by using cube data with an expression. This means that values are calculated on demand and do not have to be stored in the cube.
You should consider creating dimensions with calculated members if you want to:
- Calculate values from other members values
- Add members and measures to a cube without increasing the storage size
- Use nonadditive columns as measures in a cube
For example, you can create a calculated member named Profit by subtracting the value of a member named Costs from the value of a member named Sales.
For example, you can create a calculated member named Marks that converts dollars to marks by multiplying an existing dollar measure by a conversion rate. Marks can then be displayed to users in a separate row or column.
Because values are calculated in memory, and only the calculated member definitions are stored, values in Marks are displayed to users but are not stored as cube data.
For example, an account number is a nonadditive column. You can use the COUNT function with the nonadditive column to generate results that can then be used as a measure.
TIP
OLAP Services provides an extensive function library to use with calculated members. It also supports Microsoft Visual Basic for Applications Expression Services, Microsoft Excel worksheets, and user-defined function libraries that are registered with the service.
Defining Calculated Members
You can use the Calculated Member Builder in the Cube Editor to define calculated members. In the Calculated Member Builder, you need to specify the following things:
- The parent dimension or measure of the calculated member. Your calculated member becomes a member of this dimension. If you select Measures for the parent, then your calculated member becomes a measure.
- The parent member of the calculated member. Your member must be positioned in the dimension hierarchy of its parent dimension. You need to select a member of the parent dimension that will include your calculated member. You cannot specify a parent member if the parent dimension for your calculated member is Measures. The Calculated Member Builder presents a list of the members of the parent dimension to make it easy for you to select the parent member.
- The name of the calculated member. This name appears as the column or row heading for the calculated member values when users browse the cube.
- The expression that produces the values of the calculated member. The expression may contain data, arithmetic operators, or numbers.
For example, if you are creating a member that calculates profit from a sales measure and a cost measure, then the calculated profit measure becomes a member of Measures.
For example, you could create four calculated members that calculate whether a date in a time dimension falls in Spring, Summer, Fall, or Winter. A member of the year level, such as 1997, 1998, or 1999, could be the parent member of these calculated members.
Figure 9.5 shows the Calculated Member Builder.
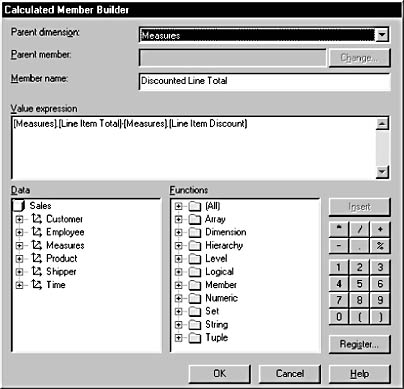
Figure 9.5 The Calculated Member Builder
Designing and Building Aggregations
As we discussed earlier, aggregations are precalculated data summaries that enable a faster response time to queries. By storing precalculated values, the server does not have to retrieve all the base data and perform a sum or other numerical calculation. Using aggregations is the basis for rapid response from an OLAP system.
Cubes are the method of storing aggregations in an OLAP system. Dimensions are the means of querying the cube. The aggregations are stored at the intersections of the dimensions. Each intersection (called a cell) stores an aggregate value.
Considerations
Adding more aggregations generally enhances performance. However, you should consider the following factors:
- Disk space At some point, the extra disk space used by each new aggregation is not worth the performance gain resulting from the creation of that aggregation. It is important to determine the most important aggregations and create them first, and then use the monitoring tools to look for new aggregations that should be created, or to remove aggregations that are rarely used.
- Cube processing time The more aggregations you add to the cube, the longer it will take to process the cube if the cube data has to be rebuilt or receives significant updates.
- Data explosion Data explosion is a problem caused by having too many aggregations. If all possible aggregations are calculated, the storage space required can be enormous. OLAP Services uses an advanced algorithm to determine the aggregations it needs to create and the ones it can calculate quickly based on other aggregations, thereby striking the optimum balance between performance and required storage space.
Data explosion can be a serious problem in a data warehouse. Figure 9.6 depicts four data cells: Boston Hardware, Boston Software, New York Hardware, and New York Software.

Figure 9.6 Granular data warehouse data
Figure 9.7 illustrates the data explosion that occurs by adding aggregations for higher levels of the dimensions from Figure 9.6. Five additional cells are added: Northeast Hardware, Northeast Software, Boston Computer Products, New York Computer Products, and Northeast Computer Products. Each additional dimension level would greatly increase the number of values to be calculated. Adding extra dimensions would increase the number of aggregations even more dramatically. As the number of aggregations grows, the amount of disk space used grows. The data explosion ratio depends on the number of dimensions, the levels of the hierarchies, and the parent/child ratios between levels in the hierarchy.
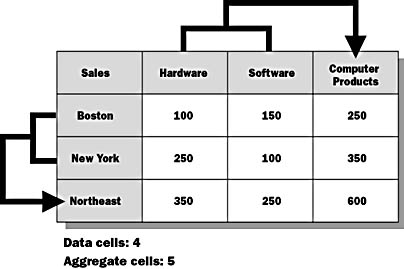
Figure 9.7 Data with aggregations showing explosion
How OLAP Services Handles Data Explosion
OLAP Services includes the Storage Design wizard that calculates the performance gain from building a certain percentage of aggregations. The Storage Design wizard, shown in Figure 9.8, handles data explosion by finding the "80/20" rule in the data. In other words, it is common for 20 percent of all possible pre-aggregations to provide 80 percent of performance gain. The wizard also analyzes level counts for each dimension and parent/child ratios for each level.
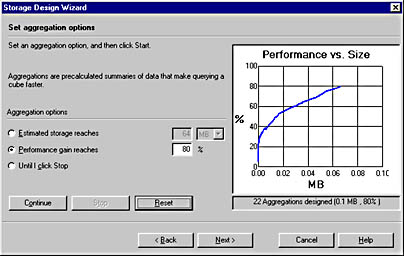
Figure 9.8 The OLAP Services Storage Design wizard

Exercise: Creating Shared Dimensions
A cube consists of measures (or quantitative data, such as sales or costs) and dimensions (or descriptive data, such as geographical regions, time, or customer demographics). In this exercise, you will use the Dimension wizard to build three dimensions for your cube: Time, Product, and Customer.
- In the OLAP Manager console tree, expand your server and then expand the Northwind_DSS database. Expand the Library folder, right-click the Shared Dimensions folder, point to New Dimension, and then click Wizard.
- In the Dimension Wizard, click A single dimension table (flat or star schema), and then click Next.
- On the Select the dimension table page, expand Northwind_Mart, and then click Time_Dim. Click Next.
- On the Select the dimension type page, click Time dimension. For the Date column, use TheDate. Click Next.
- To define the levels for your dimension, click the Select time levels drop-down list and then click Year, Quarter, Month, and Day. Click Next.
- On the Finish the Dimension Wizard page, type Time for the name of your new dimension.
- Click Finish to create the Time dimension and go to the Dimension Editor.
- On the Dimension Editor toolbar, click File, point to New Dimension, and then click Wizard.
- In the Dimension wizard, click A single dimension table (flat or star schema), and then click Next.
- On the Select the dimension tables page, in the Available tables list, expand Northwind_Mart, and then click Product_Dim.
- Click the Browse Data button to look at the data. This is useful for viewing the data in the selected dimension table to make sure that you are building the right dimension. Close the Browse Data window, and then click Next.
- To define the levels for your dimension, under Available columns, double-click the CategoryName and ProductName columns, in that order. After you double-click each column, its name will appear under Dimension levels.
- Click Next, after you have selected these columns.
- On the Finish the Dimension Wizard page, type Product for the name of your new dimension. Click Finish to create the Product dimension and return to the Dimension Editor.
- At the bottom of the Dimension Editor window, click the Preview Dimension Data button. The preview allows you to view the Category Name and Product Name levels that the OLAP Manager dynamically creates to form the dimension.
- On the Dimension Editor toolbar, click File, point to New Dimension, and then click Wizard.
- In the Dimension wizard, click A single dimension table (flat or star schema), and then click Next.
- On the Select the dimension table page, expand Northwind_Mart, click Customer_Dim, and then click Next.
- To define the levels for your dimension, under Available columns, double-click the Country, Region, City, and CompanyName columns, in that order. After you double-click each column, its name will appear under Dimension levels. Click Next when you have selected all four columns.
- On the Finish the Dimension wizard page of the wizard, type Customer for the name of your new dimension, and then click Finish.
- On the File menu, click Exit to close the editor.
NOTE
When defining some levels, you may receive warning messages that the child level has fewer members than the parent level. This is not an error; it is a warning because most child levels have more members than their parent level. If you know that in your cube, the child level should have fewer members than its parent, then you can click Yes to continue. This warning is expected when you define the Region level in the Customer dimension. The Region column stores the state or province for each country but some countries in the Northwind_Mart database do not have Region attributes. Click Yes when this occurs.
Exercise: Building Your Cube
In this exercise, you will use the Cube wizard to build the cube that will be used for sales analysis. Using the Cube wizard, you will combine the dimensions that you defined in the previous exercise with a new dimension that you will create. The new dimension contains several measures (the quantitative data derived from the columns in the Sales_Fact fact table).
- In the OLAP Manager console tree, expand the Northwind_DSS database. Right-click the Cubes folder, point to New Cube, and then click Wizard.
- On the Welcome page of the Cube Wizard, click Next.
- On the Select a fact table for you cube page, expand the Northwind_Mart data source, and then click Sales_Fact. Click Next.
- To define the measures for your cube, under Fact table numeric columns, double-click the Line Item Total, Line Item Quantity, and Line Item Discount columns, in that order. Click Next.
- Because you now need to add all of the defined dimensions to your cube, click the double-arrow (>>) button.
- Click New Dimension.
- In the Dimension wizard, click A single dimension table (flat or star schema), and then click Next.
- In the Select the dimension table step, expand Northwind_Mart, click Shipper_Dim, and then click Next.
- To define the levels of your dimension, under Available columns, double-click ShipperName, and then click Next.
- On the Finish the Dimension Wizard page of the wizard, type Shipper for the name of your new dimension.
- Check the Share this dimension with other cubes check box because this is a shared dimension. Click Finish.
- On the Select the dimension for your cube page, verify that the Shipper dimension appears under Cube dimensions. Click Next.
- Name your cube Sales, and then click Finish.
- In the Schema pane of the Cube Editor, you can see the fact table (with a yellow title bar) and the joined dimension tables (with blue title bars). In the Cube Editor console tree, you can preview the structure of your cube. You can edit the cube properties by clicking the Properties button.
You decide that you need another dimension that gives you data about employees. You can easily build this dimension right in the Cube Editor.
NOTE
Dimensions built in the Cube Editor are private dimensions; that is, they can be used only with the current cube on which you are working and cannot be shared with other cubes.
- In the Cube Editor, from the Insert menu, click Tables.
- In the Select Table dialog box, expand the Northwind_Mart data source, click the Employee_Dim table, and then click Add. Click Close to exit the dialog box.
- To define the new dimension, double-click the EmployeeName column in the Employee_Dim table.
- In the Map The Column dialog box, click Dimension, and then click OK.
- In the console tree, right-click Employee Name and click Rename on the pop-up menu.
- Type Employee for the name of the dimension, and then press Enter.
At this time, you decide you need another measure that is calculated from other measures. You can easily build a calculated member in the Cube Editor.
- In the Cube Editor, from the Insert menu, click Calculated Member
- Expand Measures in the tree in the Data section. Drill down (expand successive levels) until you see the measures listed for this cube.
- Drag the Line Item Total measure and drop it in the Value Expression text area.
- Click the button with the minus (-) symbol. You are adding the subtraction symbol into the expression.
- Drag the Line Item Discount measure to the Value Expression text area and drop it at the end of the expression. The expression should now read
- You are now ready to save the calculated member. You must give your calculated member a name. In the Member name text box, type Discounted Line Total.
- Click OK.
- Click the Save button on the toolbar to save the cube definition.
In the Calculated Member Builder, you will build the calculated member from the measures that have already been added to the cube.
[Measures].[Line Item Total]-[Measures].[Line Item Discount]
Exercise: Designing Aggregations and Processing the Cube
OLAP Services allows you to calculate aggregations, which greatly improves the efficiency and response time of queries. In the following exercise, we see how to use the Storage Design wizard to specify the way that OLAP Services stores these aggregations and to optimize query processing performance for your cube.
- In the Cube Editor, on the Tools menu, click Design Storage.
- On the Storage Design Wizard Welcome page, click Next.
- Select ROLAP as your data storage type, and then click Next.
- Under Aggregations options, click Performance gain reaches.
- In the text box, type 80.
- Click Start.
- When the process of designing aggregations is complete, click Next.
- Click Process Now, and then click Finish.
- Click Close to return to the Cube Editor.
- On the File menu, click Exit to close the Cube Editor and return to the OLAP Manager console tree.
- In SQL Server Enterprise Manager, expand the Northwind_Mart database.
You are instructing OLAP Services to give a performance boost of up to 80 percent, regardless of how much disk space this requires. Administrators can use this tuning ability to balance the need to improve query performance against the disk space required to store aggregation data.
You can watch the Performance vs. Size graph on the right of the screen as OLAP Services designs the aggregations. Here you can clearly see how increasing performance gain requires additional disk space.
The Process window appears in which you can see your cube being processed. When processing is complete, a message appears, stating that processing has completed successfully.
Click Tables, and notice all the new tables with the Sales_Sales1 prefix listed in the right pane. If you do not see the tables, press F5 to refresh the information. These tables are the OLAP aggregates that are stored in the relational Northwind_Mart database because you chose ROLAP as the storage mechanism for the cube data. We discussed OLAP Services storage options in Chapter 5 and we will get into much greater detail in Lesson 4, later in this chapter.
- In the OLAP Manager console tree, expand the Northwind_DSS database, expand Cubes, right-click the Sales cube, and then click Browse Data.
- Click Close to return to the OLAP Manager console tree.
The Cube Browser appears, displaying a grid made up of one dimension and the measures of your cube. The additional dimensions appear in the top of the browser.
Lesson Summary
This lesson described private and shared dimensions and how they are impacted by aggregations You must understand the choices that you make when creating dimensions and how they relate to your hardware requirements. You also learned how to build and edit data cubes using both the Cube wizard and the Cube Editor.
EAN: 2147483647
Pages: 114