Tool 222: Yield Chart
| AKA | N/A |
| Classification | Analyzing/Trending (AT) |
Tool description
A yield chart shows trends in the quality characteristics of a process; there is also a reflection of process capability. Output data is monitored over time, and the percentage of nondiscrepant (or conforming to specifications) units is identified as the first time yield (FTY). A yield chart can also be used to plot internal or rolled yield, which is the cumulation of individual output yields within a process.
Typical application
-
To measure process variability.
-
To identify if problem-solving action needs to be taken at a particular process output stage.
-
To track and display the amount of variation in process characteristics.
Problem-solving phase
| → | Select and define problem or opportunity |
| → | Identify and analyze causes or potential change |
| Develop and plan possible solutions or change | |
| → | Implement and evaluate solution or change |
| → | Measure and report solution or change results |
| Recognize and reward team efforts |
Typically used by
| 1 | Research/statistics |
| Creativity/innovation | |
| 3 | Engineering |
| 2 | Project management |
| 4 | Manufacturing |
| 5 | Marketing/sales |
| Administration/documentation | |
| Servicing/support | |
| Customer/quality metrics | |
| Change management |
before
-
Data Collection Strategy
-
Interview Technique
-
Surveying
-
Information Needs Analysis
-
Checksheet
after
-
Cost-Benefit Analysis
-
Monthly Assessment Schedule
-
Variance Analysis
-
Process Analysis
-
Problem Analysis
Notes and key points
-
Yield metrics affect many other measurements:
-
Cycle time of processes
-
Schedule linearity or delays
-
Unit costs or total product costs
-
Total costs of operation
-
Indication of defects per unit (DPU) level
-
Indication of process capability (CP)
-
Indication of stockouts
-
Indication of on-time delivery
-
-
Basic calculations:
Rolled yield example: Workstation #2 test 72% units passed X workstation #3 test 68% units passed = 49% rolled yield (.72 X .68 = .49).
Step-by-step procedure
-
STEP 1 First, the data collection process is established for the production units to be measured, units to be counted, the time period to be covered, and the frequency with which units are to be measured.
-
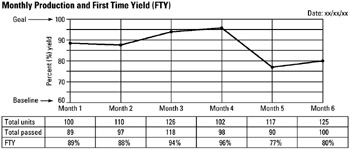
STEP 2 A yield chart is constructed for the production units to be measured. See example Monthly Production and First Time Yield (FTY).
-
STEP 3 Units produced and units passed are recorded each month. The first time yield (FTY) is calculated and recorded as shown in the example. The start date of the yield chart is shown for historical data trace purposes.
-
STEP 4 The completed yield chart is submitted to quality or upper management for further analysis and action.
Example of tool application
EAN: 2147483647
Pages: 326