Tool 208: Two-Dimensional Survey Crid
| AKA | Two-Dimensional Scatter Diagram |
| Classification | Data Collecting (DC) |
Tool description
The two-dimensional survey grid is a powerful data collection tool that is superior to other one-dimensional survey research techniques in that it can be used effectively to establish baselines that would point to needed improvement. It is especially useful in determining existing customer satisfaction levels, identifying performance gaps, or checking perception of quality, morale, or any other people issues.
Typical application
-
To focus problem-solving or process-improvement efforts on concerns or issues most important to the customer.
-
To measure and compare performance for internal or external customers.
-
To translate and prioritize customer feedback.
-
To plot, rank, and interpret survey data for possible corrective action.
Problem-solving phase
| → | Select and define problem or opportunity |
| → | Identify and analyze causes or potential change |
| Develop and plan possible solutions or change | |
| Implement and evaluate solution or change | |
| → | Measure and report solution or change results |
| Recognize and reward team efforts |
Typically used by
| 3 | Research/statistics |
| Creativity/innovation | |
| Engineering | |
| 4 | Project management |
| Manufacturing | |
| 2 | Marketing/sales |
| Administration/documentation | |
| Servicing/support | |
| 1 | Customer/quality metrics |
| Change management |
before
-
Audience Analysis
-
Needs Analysis
-
Data Collection Strategy
-
Surveying
-
Questionnaires
after
-
Consensus Decision Making
-
Gap Analysis
-
Interview Technique
-
Focus Group
-
Action Plan
Notes and key points
-
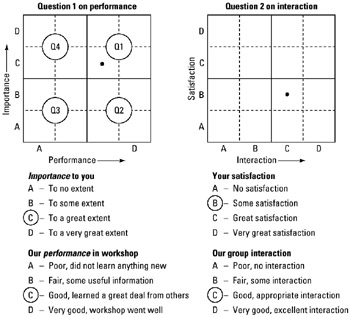
Scaling example: TQM Workshop Participant Survey
Step-by-step procedure
-
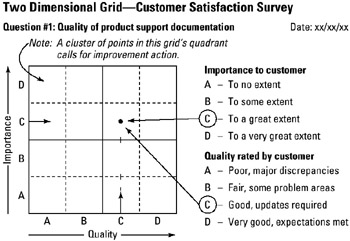
STEP 1 Develop a two-dimensional survey instrument with 10 to 12 questions covering three to four areas of concern. See example Two Dimensional Grid—Customer Satisfaction Survey.
-
STEP 2 Draw and designate grids for each question's related pair of response choice groups seen in the example as importance to customer by quality rated by customer with respective choices A–D.
-
STEP 3 Administer the survey, collect the response data and plot corresponding intersects on respective grids.
-
STEP 4 Assess scatter points (clusters) and determine if improvement action is required. For example, if a cluster of data points falls into quadrant four (Q4), problem-solving or improvement work needs to initiated.
-
STEP 5 Lastly, summarize the survey results and develop a proposed action plan.
Example of tool application
EAN: 2147483647
Pages: 326
- ERP Systems Impact on Organizations
- The Second Wave ERP Market: An Australian Viewpoint
- Intrinsic and Contextual Data Quality: The Effect of Media and Personal Involvement
- A Hybrid Clustering Technique to Improve Patient Data Quality
- Development of Interactive Web Sites to Enhance Police/Community Relations