Tool 195: Systems Analysis Diagram
| AKA | Input-Output Analysis |
| Classification | Analyzing/Trending (AT) |
Tool description
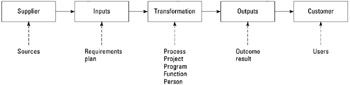
A system analysis diagram is a tool that systematically illustrates the process flow from the supply side (or input of resources), to the transformation or throughput of product or services, to the output side for final quality verification and release to the customer. This diagram helps to identify interrelationships of major taks, work phases, and opportunities for improvements through the use of feedback loops at the organization and the customer levels.
Typical application
-
To overview the sequential production or service processes, lines of communication, and quality feedback loops.
-
To reach a common understanding using the systems approach.
-
To clarify roles, task responsibilities, and system requirements.
Problem-solving phase
| → | Select and define problem or opportunity |
| → | Identify and analyze causes or potential change |
| → | Develop and plan possible solutions or change |
| Implement and evaluate solution or change | |
| Measure and report solution or change results | |
| Recognize and reward team efforts |
Typically used by
| Research/statistics | |
| Creativity/innovation | |
| 3 | Engineering |
| 2 | Project management |
| 6 | Manufacturing |
| Marketing/sales | |
| 5 | Administration/documentation |
| 4 | Servicing/support |
| Customer/quality metrics | |
| 1 | Change management |
before
-
Block Diagram
-
Organization Chart
-
Organization Mapping
-
House of Quality
-
Process Analysis
after
-
Process Mapping
-
Symbolic Flowchart
-
Cycle Time Flowchart
-
Work Flow Analysis (WFA)
-
Value/non-Value-Added Cycle Time Chart
Notes and key points
-
Other headings or designations can be substituted for the generic systems analysis diagram headings:
Step-by-step procedure
-
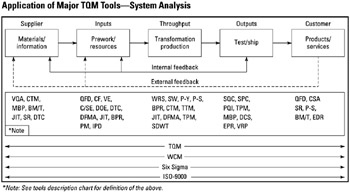
STEP 1 The team develops a Systems Analysis Diagram consisting of five blocks, interconnected, and with internal and external feedback loops added. See example Application of Major TQM Tools—System Analysis.
-
STEP 2 The blocks are designated to contain processing or requirements information as shown in the example.
-
STEP 3 Using the completed Systems Analysis Diagram as a guide, the team explores potential problem areas and process improvement opportunities.
Example of tool application
EAN: 2147483647
Pages: 326