Tool 150: Process Mapping
| AKA | Cross-Functional Process Map |
| Classification | Changing/Implementing (CI) |
Tool description
The process mapping tool is of great value for teams in documenting the existing process. It identifies and maps all cross-functional processes, process owners (organizations), metrics, and estimated processing time or mapped activities. A finalized process map ensures a thorough understanding of the □as is □process and provides baseline input data for a process improvement team.
Typically application
-
To mark a visual map of the process in order to perform the analysis necessary for identifying problematic conditions.
-
To identify, map, analyze, and prepare as is and should be process maps.
-
To draw a map for process understanding and to discover potential areas for improvement.
-
To reduce cycle time of mapped activities.
Problem-solving phase
| → | Select and define problem or opportunity |
| → | Identify and analyze causes or potential change |
| Develop and plan possible solutions or change | |
| Implement and evaluate solution or change | |
| Measure and report solution or change results | |
| Recognize and reward team efforts |
Typically used by
| Research/statistics | |
| Creativity/innovation | |
| 4 | Engineering |
| 2 | Project management |
| 3 | Manufacturing |
| Marketing/sales | |
| Administration/documentation | |
| Servicing/support | |
| Customer/quality metrics | |
| 1 | Change management |
before
-
Affinity Diagram
-
Systems Analysis Diagram
-
Pareto Chart
-
Potential Problem Analysis (PPA)
-
Needs Analysis
after
-
Cycle Time Flowchart
-
Gap Analysis
-
Force Field Analysis (FFA)
-
Barriers-and-Aids Analysis
-
Activity analysis
Notes and key points
-
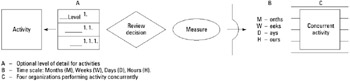
Symbols and scale:
-
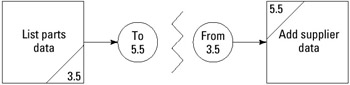
□ Connectors□ example:
-
A process map can be developed at the macro, mini, or micro level of an organizational process.
Step-by-step procedure
-
STEP 1 A team facilitator assembles a team of cross-functional representatives to assist the development of the process map.
-
STEP 2 The team decides on the level of detail to be mapped □ that is macro (overview), mini (most activities), and micro (very detailed, specific tasks).
-
STEP 3 Next, the process start and stop points are determined.
-
STEP 4 As a prerequisite activity, four flip charts are prepared to serve as input data to the process-mapping procedure:
-
A listing of all organizations or work groups. Sequence list in order of occurrence.
-
A listing of all major functions or activities. Sequence list in order of occurrence.
-
A listing of all reviews, audits, approvals, or other decision-making activities. Sequence list in order of occurrence.
-
A listing of all measurements (metrics) in the following categories: process, results, resources, and customer satisfaction. Sequence list in order of occurrence.
-
-
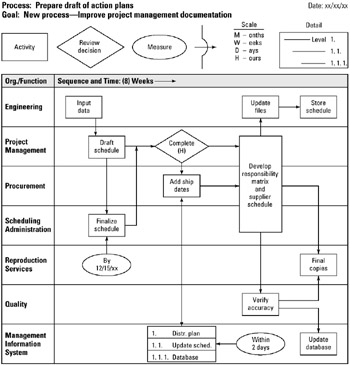
STEP 5 The team facilitator, on a whiteboard, draws the process map as directed and checked by the team. The listings of process sequences □ organizations □ □ major functions, □ □ decision-making, □ and □ metrics □ are referenced, in order of occurrence, to map out the complete process. See example Process: Prepare Draft of Action Plans.
-
STEP 6 Finally, the team checks the completed map, final revisions are made, and the map is titled and dated. The facilitator redraws the process map on flip charts for future reference.
Example of tool application
EAN: 2147483647
Pages: 326