Flylib.com

Books Software


Tool 118: Nominal Prioritization


Tool 118: Nominal Prioritization

AKA 

N/A

Classification 

Evaluating/Selecting (ES)

Tool description

The nominal prioritization tool is an easy and quick method for a team to team-prioritize from a list of items, proposed actions, or various options. It can also be used to team-select a particular problem or opportunity from a previously brainstormed list.

Typical application

  • To prioritize from a list of brainstormed items or options.

  • To involve all team participants in the selection process of the preferred choices.

  • To determine a " next -step" approach in a team problem-solving effort.

Problem-solving phase

Select and define problem or opportunity


Identify and analyze causes or potential change

Develop and plan possible solutions or change


Implement and evaluate solution or change


Measure and report solution or change results

Recognize and reward team efforts

Typically used by


Research/statistics


Creativity/innovation


Engineering


Project management

4

Manufacturing


Marketing/sales

3

Administration/documentation

2

Servicing/support


Customer/quality metrics

1

Change management

start sidebar
links to other tools

before

  • Brainstorming

  • Brainwriting Pool

  • Crawford Slip Method

  • Double Reversal

  • Importance Weighting

after

  • Consensus Decision Making

  • Starbursting

  • Different Point of View

  • Run-It-By

  • Criteria Filtering

end sidebar

Notes and key points

  • Optional approach: A team facilitator may provide participants the opportunity to present and explain why they considered certain items as their second and third selections.

Step-by-step procedure

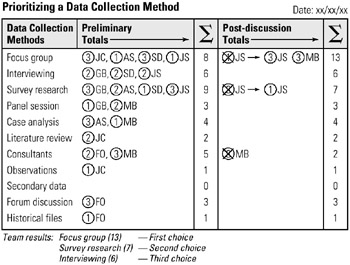
  • STEP 1 The team facilitator displays a flip chart with a list of items or options. See example Prioritizing a Data Collection Method .

  • STEP 2 Team participants are asked to review the entire list and select the top three choices.

  • STEP 3 Every participant moves to the flip chart and marks the top or most important choice by writing a 3, marks the second choice a 2, and the third choice a 1. All marked choices also require the participants' initials for possible future reference. This concludes the preliminary selection process.

  • STEP 4 The team facilitator totals up the scores of all selected items and ranks the top three choices. The highest scored item is, therefore, also what the team considers the most important item.

  • STEP 5 In the next step, participants give a rationale for selecting their most important choice. This discussion should be limited to 2-3 minutes per participant.

  • STEP 6 Once all participants have a chance to explain why a particular change was made, participants are now given the opportunity to change their selections.

  • STEP 7 Lastly, the facilitator retotals, if needed, all selections, and lists the final top three choices on a flip chart and dates the chart.

Example of tool application

click to expand


Tool 119: Normal Probability Distribution

AKA 

Gaussian Curve

Classification 

Analyzing/Trending (AT)

Tool description

The normal probability distribution is used extensively in statistical process control (SPC) applications, the profiling and describing of various data distributions, and in the hypothesis testing procedures (inferential statistics) found in scientific research. The concepts of normally distributed sample data provide the basis for inferences made about a population based on samples taken from the source population.

Typical application

  • To illustrate variability of data.

  • To apply the "normal" pattern concepts to statistical process control activities.

  • To demonstrate data significance, allow transformations, and display measurement scales and their relationship under the curve.

Problem-solving phase


Select and define problem or opportunity

Identify and analyze causes or potential change


Develop and plan possible solutions or change


Implement and evaluate solution or change

Measure and report solution or change results


Recognize and reward team efforts

Typically used by

1

Research/statistics


Creativity/innovation

2

Engineering


Project management


Manufacturing


Marketing/sales


Administration/documentation


Servicing/support

3

Customer/quality metrics


Change management

start sidebar
links to other tools

before

  • Data Collection Strategy

  • Surveying

  • Frequency Distribution (FD)

  • Standard Deviation

  • Cluster Analysis

after

  • Descriptive Statistics

  • Process Capability Ratios

  • Analysis of Variance

  • Control Chart

  • Response Matrix Analysis

end sidebar

Notes and key points

  • The normal probability distribution is a symmetrical, bell-shaped distribution frequently used in statistical analyses. The arithmetic mean, median and mode are of equal value and are located at the center and peak of the curve. These measures are averages and therefore considered measures of central tendency. Measures of dispersion are measures under the curve, moving horizontally left or right to identify areas or probability, among others, standard deviations ( S ), z -values ( z ), and percentiles (%) are most often used in descriptive and inferential statistics.

    click to expand

  • Please refer to Appendix, Table A, "Proportions of Area Under the Normal Curve," for a detailed table.

    click to expand

Step-by-step procedure

  • STEP 1 Collect a sample of data for the purpose of checking quality goals, process capability, or probability of defects (excessive variability). See example Normalizing Sample Data for SPC Applications .

  • STEP 2 Calculate the population mean ( μ ) and standard deviation ( σ ).

  • STEP 3 Transform any measurement, using the z -score equation as shown in this example.

  • STEP 4 Refer to the Proportions of Area Under the Normal Curve table to locate the percentage of probability of area under the curve (See Appendix, Table A.)

Example of tool application

click to expand