Tool 112: Morphological Analysis
| AKA | Morphological Forced Connections, Idea Box, Morphological Box |
| Classification | Idea Generating (IG) |
Tool description
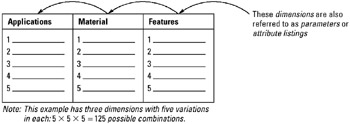
Morphological analysis is a tool used to surface new or improved products or services. Usually three or more dimensions are identified for a particular subject or problem, and variations for each dimension are brainstormed to develop lists of attributes. By scanning the attributes in each dimension, useful or interesting combinations are discovered that may form a new or improved product or service, or may be the solution to a problem.
Typical application
-
To discover new or improved products or services.
-
To combine various attributes in search for a solution to a problem.
-
To surface useful ideas by combining different variations of identified dimensions of a product or service.
Problem-solving phase
| → | Select and define problem or opportunity |
| → | Identify and analyze causes or potential change |
| → | Develop and plan possible solutions or change |
| Implement and evaluate solution or change | |
| Measure and report solution or change results | |
| Recognize and reward team efforts |
Typically used by
| Research/statistics | |
| 1 | Creativity/innovation |
| 4 | Engineering |
| Project management | |
| Manufacturing | |
| 3 | Marketing/sales |
| Administration/documentation | |
| Servicing/support | |
| Customer/quality metrics | |
| 2 | Change management |
before
-
Attribute Listing
-
Forced Choice
-
Circumrelation
-
Circle of opportunity
-
Forced association
after
-
Creativity Assessment
-
Mental Imaging
-
Checkerboard Method
-
Idea Advocate
-
Presentation
Notes and key points
-
Three- or four-dimensional morphological analyses are the most common approaches. A dimension is further defined as a characteristic, variation, factor, or aspect.
Step-by-step procedure
-
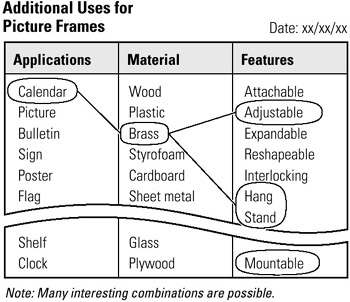
STEP 1 The team selects a problem, product, or service to be analyzed. See example Additional Users for Picture Frames.
-
STEP 2 Dimensions are identified and recorded as headings on flip charts.
-
STEP 3 Next, the team brainstorms attributes (variations) of each dimension. The facilitator clarifies each response, if needed, and records responses on the flip chart. This process continues until the team stops generating attributes.
-
STEP 4 The other dimensions are brainstormed and attributes listed on respective flip charts.
-
STEP 5 The facilitator moves all flip charts close together and participants combine the possibilities by linking the various useful attributes listed on each flip chart (one per flip chart or column).
-
STEP 6 Useful, potential, or interesting combinations are marked using different colors of flip chart markers.
-
STEP 7 Date all flip charts.
Example of tool application
EAN: 2147483647
Pages: 326
- Context Management of ERP Processes in Virtual Communities
- Distributed Data Warehouse for Geo-spatial Services
- Data Mining for Business Process Reengineering
- A Hybrid Clustering Technique to Improve Patient Data Quality
- Relevance and Micro-Relevance for the Professional as Determinants of IT-Diffusion and IT-Use in Healthcare