Tool 85: Functional Map
| AKA | Cross-Functional Matrix |
| Classification | Analyzing/Trending (AT) |
Tool description
A functional map is a multipurpose tool that can illustrate many organizational issues such as capability, performance, competitive behavior, costs and profits, market share, and others. It is often used to display important relationships, time trends, interactions, and SWOT analysis factors: strengths, weaknesses, opportunities, and threats.
Typical application
-
To determine what actions need to be taken.
-
To communicate important issues and factors to management.
-
To plot performance variables.
Problem-solving phase
| → | Select and define problem or opportunity |
| → | Identify and analyze causes or potential change |
| → | Develop and plan possible solutions or change |
| Implement and evaluate solution or change | |
| Measure and report solution or change results | |
| Recognize and reward team efforts |
Typically used by
| Research/statistics | |
| Creativity/innovation | |
| 2 | Engineering |
| 1 | Project management |
| Manufacturing | |
| 3 | Marketing/sales |
| Administration/documentation | |
| 4 | Servicing/support |
| Customer/quality metrics | |
| Change management |
before
-
Data collection strategy
-
Benchmarking
-
Matrix data analysis
-
Comparison Matrix
-
Matrix Diagram
after
-
Cost-benefit analysis
-
Balance sheet
-
Action plan
-
Basili Data Collection Method
-
Measurement Matrix
Notes and key points
-
Applications for functional maps:
-
Product development
-
Market share
-
Competition/gap analysis
-
Technology/innovation
-
Research and development
-
Products and service
-
Performance characteristics
-
Customer behavior
-
Step-by-step procedure
-
STEP 1 The first action item for team participants is to collect background data relevant to the topic to be displayed on a functional map. Benchmarking, case analyses, trade journals, and other sources should be reviewed for this purpose.
-
STEP 2 Once the appropriate data has been collected, the team decides on the forms of functional maps to be used. See notes and key points for some considerations.
-
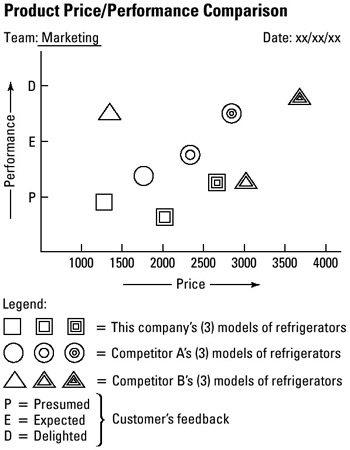
STEP 3 Two or three sets of variables are used to develop the maps. See example Product Price/Performance Comparison.
-
STEP 4 Completed maps are verified by the team and appropriate experts in the field. Revisions are made and all maps are dated.
Example of tool application
EAN: 2147483647
Pages: 326