Creating and Modifying Project Server Views
Now that you have data in the system and you have built your OLAP cube, it’s time to build the custom views you want to add to your system. Project Web Access views present in the Project Center, Resource Center, and Portfolio Analyzer. You can build your Project Center and Resource Center views at any time once you’ve made the necessary field customizations, so I might have included this information in an earlier chapter, but having data available helps you validate your view design, and there’s just no fun in building empty views! If you’re like me, you’ll want instant gratification for your efforts. Besides, you can’t build the Analyzer views until you’ve built a cube.
Project Server views fall into five categories:
-
Project Center views are portfolio-level views that display project-level information across a collection of projects. These are presented at the first level of the Project Center.
-
Project views present information for a single project. You access them by drilling down from the Project Center. These views can display information on assignments, tasks, or resources.
-
Assignment views present timesheet information when viewing assignments from the Resource Center.
-
Resource Center views are displayed in the Resource Center.
-
Portfolio Analyzer views display OLAP cube data in the form of charts and pivot tables.
Creating Gantt Chart Formats
Before you begin creating views, there are supporting customizations that you should be aware of. The Gantt chart format you apply to a view, as well as the grouping format, can be an existing format in the system or one that you customize using built-in tools. Gantt chart drawings render in Project and Assignment views in Project Web Access. Gantt charts apply to Project Center, Project views, and Assignment views. Resource Center views don’t render Gantt charts. You can define up to 22 Gantt formats for use in Project Web Access views. These formats are as follows:
-
Personal Gantt
-
Gantt Assign Info 1
-
Gantt Assign Info 2
-
Gantt Assign Info 3
-
Gantt Assign Info 4
-
Gantt Chart (Project Center)
-
Tracking (Project Center)
-
Gantt Chart (Views)
-
Detail Gantt (Views)
-
Leveling Gantt
-
Tracking Gantt
-
Gantt 1–11
The Personal Gantt and Gantt Assign Info 1 through 4 formats apply to Assignment views only. You may apply the remaining Gantt formats to Project Center views and Project views. The Personal Gantt and Gantt Assign Info 1 through 4 formats display graphic representations for the following:
-
Normal Task
-
Delegated Task
-
Milestone
-
Summary Task
-
Group By Summary
-
Progress
Project Center views and Project views display graphic representations for the following, except that detail task information doesn’t apply to Project Center views. In other words, when a Gantt chart format that includes graphic definitions for detail task information is applied to a Project Center view, task-level formatting is ignored as Project Center views display summary task and summary progress and don’t include task detail.
-
Normal Task
-
Critical Task
-
External Task
-
Milestone
-
Summary Task
-
Project Summary
-
Group By Summary
-
Progress
-
Summary Progress
-
Baseline Task
-
Baseline Summary
-
Baseline Milestone
-
Preleveled Task
-
Preleveled Summary
-
Preleveled Milestone
-
Deadline
-
Slippage
-
Delay
-
Custom Duration 1–10
-
Early Schedule
-
Late Schedule
-
External Milestone
-
Project Summary Version 1–5
For each element rendered, you determine whether the element displays, and if it does, the start and end shapes, the middle bar shape, and the color. To specify a Gantt style, in Project Web Access select Admin ![]() Customize Microsoft Project Web Access
Customize Microsoft Project Web Access ![]() Gantt Chart formats. Figure 12-15 shows the Gantt Chart formats interface. Note that along the top the text tells that you that you can “Specify the bar styles and timescale for Gantt Charts.” However, the timescale adjustment capability seems to have been left out.
Gantt Chart formats. Figure 12-15 shows the Gantt Chart formats interface. Note that along the top the text tells that you that you can “Specify the bar styles and timescale for Gantt Charts.” However, the timescale adjustment capability seems to have been left out.
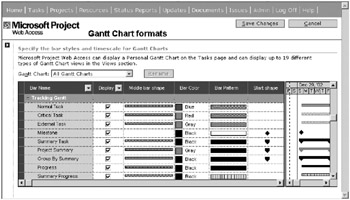
Figure 12-15. The Gantt Chart formats interface
With a selection of 11 bar styles, 14 distinct start and end shapes, and 15 colors as shown in Figure 12-16, you can create a distinctive look to offset and emphasize information as you choose.
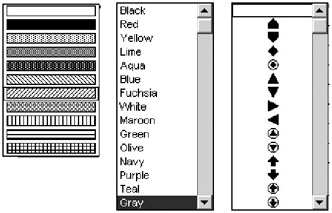
Figure 12-16. Combine bar styles, start and end shapes, and color selections to produce a unique look.
Creating Grouping Formats
Project Server allows you to apply colorful formatting to your grouping levels in views and in the timesheet. Although the timesheet has one and only one grouping format, a view in the Project Center or Resource Center as well as detailed Project and Assignment views may have any of the other ten grouping formats applied. The configurable grouping formats are as follows:
-
Timesheet
-
Views
-
Grouping 1–9
You may determine the style of each grouping level display by selecting the following criteria:
-
Cell Color
-
Cell Pattern
-
Font Color
-
Font Style
Your color choices for cell colors and font colors for grouping formats are the same 15 basic colors offered for Gantt chart formatting. Similarly, the cell pattern styles available to you for grouping formats are identical to the bar style selections for Gantt charts. Refer back to Figure 12-16 for these selections. Because grouping styles apply to informational display, font styles are added to the pallet. Select from the standard normal, italic, bold, and bold italic styles for your grouping format.
Creating and Modifying Project Web Access Views
Selecting Manage views from the Admin menu in Project Web Access brings you to the Specify Views interface shown in Figure 12-17. The label “Specify Views” is a leftover from Project Central; don’t let the inconsistency bother you. The display shows all current views in the system, grouped by view type. In order to modify or delete a particular view, you must select it in the grid and then click Modify View or Delete View. When you add a view, the system will assume that you want to add the type of view you’ve selected in the grid and it displays the succeeding screen accordingly. You can change the view type once in the second screen. Click the Add View button.
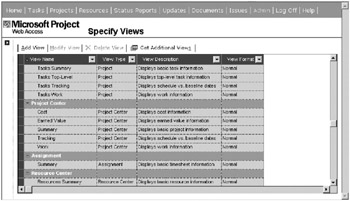
Figure 12-17. You can add or modify a Project Web Access view.
The first step in creating a new view is to choose a view type. As noted in the previous paragraph, you can preselect the type in the previous screen or select it in the Specify Views screen shown in Figure 12-18. Selecting a different type changes the field selections and other selections on the screen according to their applicability to the view type specified. For instance, the Table section applies only to Project views, which display detailed project information. Selecting a different type of view removes this section from the display. For this example, I create a Project Center view and make that selection accordingly.
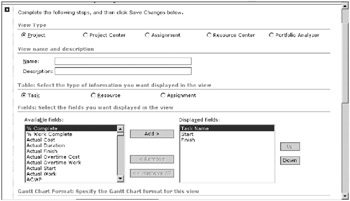
Figure 12-18. Specify the view type, name, and description.
The next step is to specify the fields that you want to appear in your new view. In Figure 12-19, I selected Enterprise Project Text1, a field that displays a graphical indicator based on budget variance. It’s very important that you have your configuration document handy, as you can see that the custom name of the field isn’t displayed in the interface. Each view has its own default fields that you can’t remove; however, you can alter their display order by using the Up and Down buttons in the interface. Select a Gantt chart format, grouping format, and the categories to which this view belongs and click Save Changes. The system will report success.
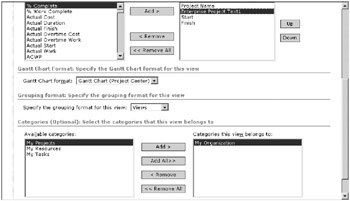
Figure 12-19. Specify fields, a Gantt chart format, a grouping style, and categories for the new view.
The system provides a section for building a filter into your view for Project views and Resource Center views. The filter builder allows you to set up to three tests for field values to filter data out of the selection. In Project views you can filter out tasks, and in Resource Center views you can filter out resources returned by the view. You may test fields for specific values with and/or conditions specified for up to three distinct tests.
The new view is now available in the Project Center, as shown in Figure 12-20. Notice that the view selection now appears in the “Choose a view” selection list and displays in the Project Center.
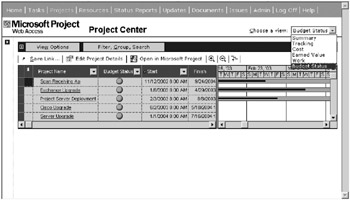
Figure 12-20. Your new view displayed in the Project Center
Creating Analyzer Views
Selecting Portfolio Analyzer as the view type in Figure 12-18 causes the display to change. If this is the first time you’re attempting to create an Analyzer view, the screen shown in Figure 12-21 displays. Click the link to install the Office Web Components. Keep in mind that you must have a license for Office XP or greater, Project Standard, or Project Professional on your machine to get the fully functioning version of the Web Components activated. Otherwise, you’ll get a runtime version that doesn’t give you the functionality required to create Analyzer views.
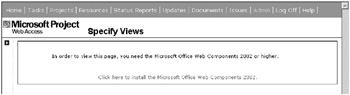
Figure 12-21. Click the link to install the Microsoft Office Web Components 2002.
A File Download dialog box appears, as shown in Figure 12-22. Select “Run this program from its current location” and click OK to continue.
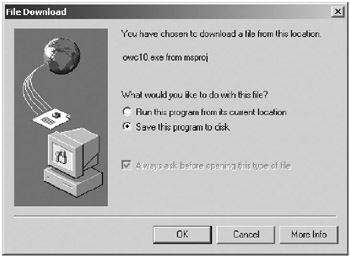
Figure 12-22. The File Download dialog box for the Office Web Components
A security warning displays. Select Yes to trust content from Microsoft. The download proceeds and the installation starts. Accept the license agreement and click the Install button. If you’re running the installation from the server, rather than downloading the .exe file and then installing, the system will prompt you to close Project Web Access and any other Office program that may be running. The installation dialog box reports progress, as shown in Figure 12-23.
Figure 12-23. The Microsoft Office XP Web Components installer reports progress. When the installation completes, a confirmation dialog box displays.
Once the Office Web Components have been installed on the workstation you’re creating the views from, you can continue to create your first Analyzer view. Because Analyzer views are highly dependent on enterprise custom data, no pre-built Analyzer views are included with the system. Once you select Portfolio Analyzer in the view type section, the display changes to accommodate an Analyzer view build, as shown in Figure 12-24. You must enter a name for the view, provide an optional description, and choose an Analyzer mode. Analyzer views may be created as PivotTable only, as Chart only, or as a combination view. You must select one of these options. The display changes according to your selection. In the figure, I’ve chosen to include both a chart and pivot table in the view.
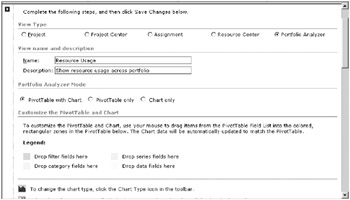
Figure 12-24. Enter a name for the view and select the Portfolio Analyzer view type.
The pivot table design area, shown in Figure 12-25, provides a design canvas for your view. Drag and drop totals and dimensions from the PivotTable Field List dialog box shown on the right side of the figure. The PivotTable Field List dialog box floats in the display, and you can send it to the background by clicking anywhere in the display behind it. To bring the dialog box forward, click the exclamation point icon on the toolbar above the design space.
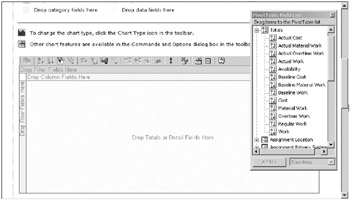
Figure 12-25. The pivot table design area
Notice that there are two icon types in the PivotTable Field List dialog box. The icons resembling dominos, with the 1-0 binary pattern, are fact totals, whereas the fields identified with the grouping representation in the icon are the dimensions. The system creates four default dimensions:
-
Project dimension contains the project names for all projects in the system.
-
Project version dimension contains each project and version combination.
-
Time dimension contains time settings, years, quarters, months, and days.
-
Resource dimension contains all resource names.
All of the other dimensions you see listed in the field list dialog box are the enterprise outline codes that you created during system configuration. Here you can see the importance of these in crafting portfolio views.
The pivot table and chart design area contains drop points for fields and dimensions. The drop areas include the following:
-
Filter Fields: Drag dimensions here to use them as filters against the data.
-
Column Fields: Drag dimensions here to group data in columns.
-
Row Fields: Drag dimensions here to group data in rows.
-
Data Fields: Drag Total fields here to display data grouped by row and column dimensions.
In Figure 12-26, I first dragged the Program dimension to the Row Fields area, followed by the Project and Resource dimensions. Next, I added the Assignment Location to the Filter Fields area. Then, I dragged the Work, Actual Work, Cost, and Actual Cost totals fields into the Data Fields area. The resulting view allows the user to expand the programs and view these by project. Expanding the project then allows the user to look at the totals by resource for the project.
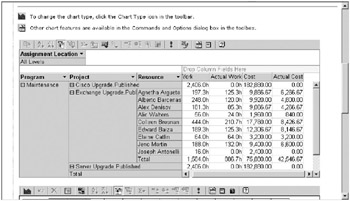
Figure 12-26. This design provides a view of the portfolio by program, then by project and resource.
While I build the pivot table, the chart area is responding in kind because I selected to build a pivot table and chart. The resulting chart build is shown in Figure 12-27. The chart is scaled according to the largest dimension on the X or Y axis. You can see that it may not be very meaningful to attempt to display both dollars and hours on the same chart. Perhaps I should have selected PivotTable only for this Analyzer view.
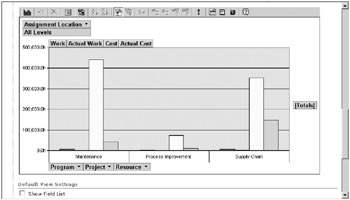
Figure 12-27. The chart updates automatically while the pivot table is constructed.
Click the Chart Type icon on the far left of the Chart toolbar, which runs across the design area, to open the Commands and Options dialog box shown in Figure 12-28. The system supports 12 chart types and their subselections. Selecting a different chart option instantly changes the display.
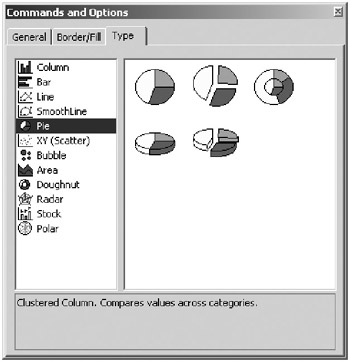
Figure 12-28. Select a chart type from the Commands and Options dialog box.
Before you save your new Analyzer view, you must select your default view settings and the categories that the new view belongs to. As shown in Figure 12-29, you can choose whether the field list and toolbars display or don’t display by default when a user accesses the view from the Project Center. This refers to the default state, although users can activate these tools in the interface. These selections don’t disable the tools. Select categories for the view and click Save Changes to make the view available to users. The resulting view available in the Project Center shows in Figure 12-30.
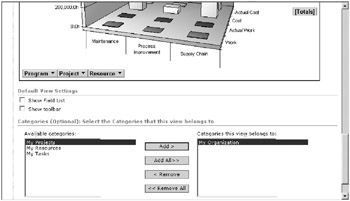
Figure 12-29. Determine default view settings and categories for your view.
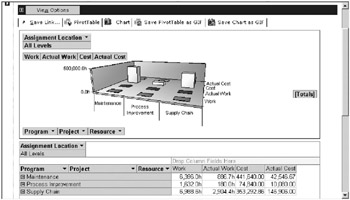
Figure 12-30. Your completed view is available from the Project Center.
Additional functionality, provided on the toolbar and shown in Figure 12-31, is useable when designing or when accessing the completed view. You can highlight a column and change the sort order by using one of the AZ icons to reverse the sort order. Next in line is the Auto Filter icon, which is active anytime you add a dimension to the filter area. The second filter icon, with the number 10 in the label, allows you to filter based on top/bottom number or percentage of items in the dataset. Add a custom total field using the calculator icon and change the display as a condition of a total display by clicking the icon labeled with the percent sign.
![]()
Figure 12-31. The pivot table toolbar
For users without an Office XP license, the Analyzer views that you create appear to be static. However, for users with a full Office XP license, the Analyzer views you create are starting points. When a user is armed with the full version of the Office XP Web Components, he or she can add, remove, and reshape the view with as much flexibility as you had while building it the first time.
EAN: 2147483647
Pages: 185