7.3 Building a Model
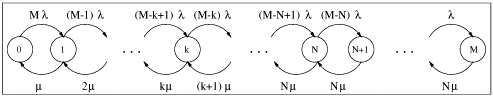
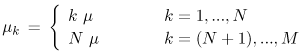
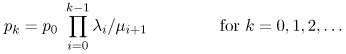
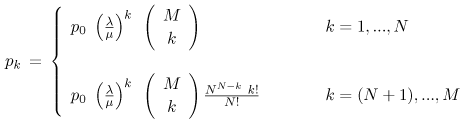
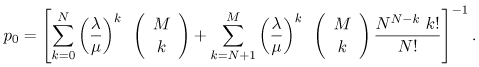
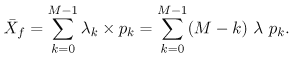
| An analytical model is built to answer the five questions posed in the previous section. The machine failure rate is denoted by l and indicates the rate at which machines move from the operational state to the failed state. Thus, each machine stays in the operational state 1/l time units, on average. This value is called the Mean Time to Failure (MTTF). It is assumed here that machines fail independently from one another and that all machines fail at the same average rate. (Note: If machines are observed to fail at different rates, a multiclass model can be constructed. In this case, machines in class r fail at rate lr. Multi-class models are considered in Chapters 13 and 14.) The machine repair rate is denoted by m. That is, the average time it takes to service one machine is 1/m time units. It is assumed here that all repair personnel have the same skill level. (Note: if different repair people have different skill levels, a heterogeneous multi-server model can be constructed with each server (i.e., repair person) having their own personal repair rate.) As Fig. 7.1 indicates, if there are fewer repair technicians than the number of machines (i.e., N < M), then there may be a queue of machines waiting to be repaired (i.e., if more than N machines are in the failed state at any one time). The system of Fig. 7.1 can be modeled by the Markov Chain (see Chapter 10) of Fig. 7.2, where state k represents the number of failed machines. A transition from state k to state k + 1 happens when a machine fails. A transition from state k to state k 1 occurs when a machine is repaired. At state k, there are M k machines in operation and each has a failure rate of l. Thus, the aggregate failure rate, lk, at state k, is given as Equation 7.3.1 Figure 7.2. Markov chain model for the data center. The aggregate repair rate, mk, at state k depends on whether or not all N repair people are busy. Therefore, Equation 7.3.2 Solving this Markov Chain means finding the steady state probabilities, pk, of being in state k (k = 0, ···, M). This solution can be obtained using the Generalized Birth-Death (GBD) theorem of Chapter 10 given that the expressions for lk and mk are known. The GBD theorem states that Equation 7.3.3 where p0 is obtained by requiring that Equation 7.3.4 where p0 is obtained by requiring that Equation 7.3.5 The average aggregate rate at which machines fail, Equation 7.3.6 The Interactive Response Time Law (see Chapter 3) can be used to compute the MTTR (i.e., the average time spent by a machine from when it fails until it is back in operation). The analogy between Fig. 3.4 and Fig. 7.1 is as follows: client workstations correspond to machines in operation, the average think time Z corresponds to the MTTF (1/l), the average response time R corresponds to the MTTR, and the system throughput X0 corresponds to the aggregate failure rate Equation 7.3.7 The average number of failed machines, Nf, can be obtained by applying Little's Law to the "black box" consisting of the queue of machines waiting to be repaired plus the set of all machines being repaired (i.e., the number of machines in the lower portion of Fig. 7.1). Hence, Equation 7.3.8 Similarly, the average number of operational machines, No, is Equation 7.3.9 which is Little's Law applied to the upper portion of Fig. 7.1. The Markov Chain model described in this section is implemented in the MS Excel work-book Chap7-MarkovModel.XLS. |

EAN: 2147483647
Pages: 166