15.6 Modeling ForkJoin Queuing Networks
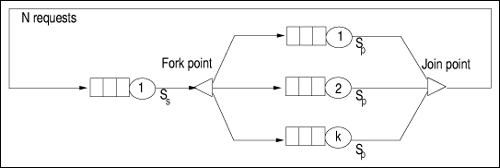
15.6 Modeling Fork/Join Queuing NetworksParallelism and concurrency in computer systems can be modeled by fork-join systems. When entering a concurrent processing stage, an arriving request forks into subtasks that are executed independently either on different service centers or on the same service center. Upon completing execution, each subtask waits at the join point for its sibling tasks to complete execution. The fork operation starts new concurrent subtasks. The join operation forces one subtask to wait for sibling subtasks. Fork/join models have been analyzed in the context of computer systems and communication networks. Fork/join queuing networks are used to model disk arrays under synchronous workloads [38]. The cache, the array controller, and the disks are represented by individual queuing service centers. The controller is modeled by a fork/join queue. Each disk is modeled by a queuing server of this fork/join queue. A request to the controller is forked into subrequests that are assigned to the disks of the disk array. An I/O request to the disk array is complete when all subrequests are complete, i.e., when they all meet at the join point. Performance models of modern servers and operating systems typically involve solving a set of non-product form closed QNs with fork/join structures. In these models, fork/join stations model the synchronization constraints between processes at different stages of execution. Obtaining the exact solution for these networks is difficult and may be costly in the case of systems with a large state space. Therefore, approximate methods are needed. This section presents the approximate solution technique proposed in [39, 40] for queuing models with fork/join synchronization. Consider that the QN consists of one or more interconnected subsystems as illustrated in the example of Fig. 15.12. Two types of subsystems are considered: Figure 15.12. Fork and join.
Consider a closed fork/join queuing network with the following parameters:
The approximate fork/join MVA solution method is based on adapting the response time equation as indicated by Eq. (15.6.37), which is an approximation derived from the arrival theorem [30]. Equation 15.6.37 where Equation 15.6.38 Equation 15.6.39 Equation 15.6.40 The relative error of this approximation was shown to be less than 5% for the majority of the cases analyzed [39]. Example 15.6.A database server consists of a powerful processor and two disk array subsystems, 1 and 2. The disk arrays operate under synchronous workload, i.e., transactions are blocked until their I/O requests complete service. A disk array improves I/O performance by striping data across multiple disks [38]. The disk array subsystems consist of k1 and k2 disks, respectively. A transaction alternates between using the processor and the I/O subsystem until it completes its execution. Previous measurements indicate that the average response time is 0.34 seconds when 10 transactions are executing concurrently. One of the SLAs for the database server is that the average response time should not exceed 1 second. Before increasing the concurrency level to 50 transactions, the performance analyst wants to predict the new response time to verify whether or not the response time SLA will continue to be satisfied. The model parameters are as follows. The processor service demand is equal to 0.01 sec and the service demands for each disk of disk arrays 1 and 2 are 0.02 and 0.03, respectively. With the purpose of keeping the example simple, the number of parallel disks in the disk arrays is set to small values, i.e., k1 = 2 and k2 = 3. The queuing model of the database server has three subsystems, the processor and the two storage systems, with two and three disks, respectively. The model is closed with n transactions in execution. Typically a disk array has three components, the cache, the controller and the disks. The disk array in this example is modeled by separate and parallel services centers, such that caching effects as well as controller overheads are implicitly represented in the disk service demands. Each disk array is modeled by parallel subsystem with a fork/join structure, where each disk is a queuing server. The parameters for the QN model are n = 50, I = 3 (i.e., three subsystems), k0 = 1 (serial execution at the processor), k1 = 2, k2 = 3 (parallel execution at the disk arrays), Dprocessor = 0.01 sec, Ddisk array 1 = 0.02 sec, and Ddisk array 2 = 0.03 sec. The solution of the algorithm presented in this section provides an average response time of 1.53 seconds, which exceed the SLA of 1 second (see the MS Excel workbook Ch15-Ex15-6.XLS). |
EAN: 2147483647
Pages: 166


