15.2 Modeling High Service Time Variability
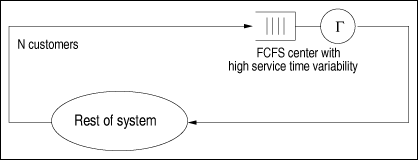
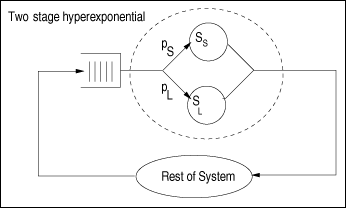
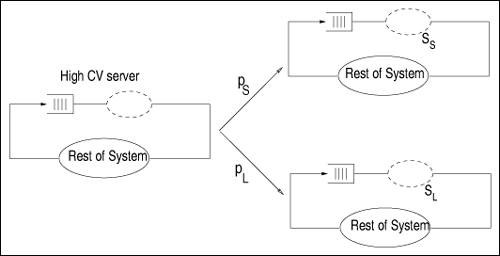
| Examples of high variability abound in computer systems. For instance, the Web shows extreme variability in workload characteristics, including file sizes and file popularity [15]. As another example, it has been shown that network arrivals, measured by packet interarrival times, are not exponentially distributed [28]. The authors also show that Poisson models underestimate the burstiness of TCP traffic. The question one may ask is: what are the sources of variability in computer systems? They are various. Here are some examples: sizes of data objects [27], files stored on Web servers [15], flow lengths traveling through the Internet, files stored in file systems [17], and process lifetimes. It is important to be able to model high service time variability, because increasing variability usually affects the performance of a system. As pointed out in [6], even a small amount of HTTP traffic burstiness degrades the throughput of a Web server. Results shown in Ref. [19] illustrate that the queuing dynamics within IP routers can be qualitatively different depending on whether the network traffic exhibits variability. The variability of a dataset can be captured by the coefficient of variation (CV), defined as the ratio of standard deviation (s) to the mean (m). Equation 15.2.1 The characteristics of the distribution function of a random variable show if the random variable has high variability. For example, the tail of a distribution (i.e., the probability that the random variable is greater than a given value) shows the likelihood of large observations. Distributions whose tail decline with a power law are called heavy-tailed. Power-laws are expressions of the form y ~ xa, where a is a constant and x and y are the measures of interest. Measurements of several systems (e.g., Internet, WWW, Ethernet traffic, file systems) show numbers that exhibit a pattern known as "heavy-tailed" [15, 17, 27]. This means that very large numbers could be present in samples of measurements, such as number of bytes transmitted, file sizes and CPU times. These extremely large numbers do affect the performance of a system and should not be ignored. A random variable X follows a heavy-tailed distribution if P[X > x] = kx a L(x) where L(x) is a slowly varying function. A Pareto distribution is a special case of heavy-tailed distribution where the number of events larger than x is an inverse power of x. Among other implications, a heavy-tailed distribution presents a great degree of variability, and a non-negligible probability of high sample values. Common distributions, such as the exponential distribution, decay much faster than heavy-tailed distributions. In a log-log plot, x a is a straight line with inclination a. Depending on the value of a, a power law distribution may have infinite mean (if a < 1) or infinite variance (if a < 2). In practice, these stastics do not occur because values are limited by measured data. Once the importance of variability is recognized, this section presents techniques to analyze models with non-exponential FCFS queues. These techniques were consolidated by Eager, Sorin, and Vernon in [18]. 15.2.1 The Decomposition ApproachConsider a closed single-class queuing model with N customers and a FCFS queuing center G that has exponentially distributed service time (see Fig. 15.1). Let SG be the average service time at this service center. When the service time of service center G is not exponentially distributed and has a coefficient of variation (CVG), the response time at G can be approximated by Equation 15.2.2 where UG(N) is the utilization of the service center G, nG(N) is the average queue length at G, and L is an estimate [31] (given below) of the mean residual service time of the customer in service at an arrival instant, considering that arrivals do occur at random points in time. Note that Eq. (15.2.2) uses the Schweitzer [35] approximation for the response time equation already discussed in Chapter 13. Equation 15.2.3 The approximation of Eq. (15.2.2) was found to be too pessimistic for centers that have high coefficient of variation for the service time [18]. Figure 15.1. FCFS service center with high service time variability. An alternative approach to solving QN models with high service time variability was proposed in [41]. First of all, the service center G with high service time variability is synthesized as having a hyperexponential service time distribution as shown in Fig. 15.2. With probability pS, customers who visit service center G experience a "short" exponentially distributed service time with average SS. With probability pL = 1 pS, customers have a "long" exponentially distributed service time with average SL. The problem now is given an empirical service time distribution at service center G with average service time SG and coefficient of variation CVG find the values of pS, pL, SS and SL that match SG and CVG. It can be easily shown (see Exercise 15.1) that Equation 15.2.4 Equation 15.2.5 This system of equations has three unknowns (pS, SS, and SL) and two equations. To solve it, one needs to guess one of the values. A good variable to guess is the probability pS. Figure 15.2. Model of a queue with high service time variability. One can now explain, with the help of Fig. 15.3, how the approach proposed in [41] works. The QN on the left of the figure is replaced by two QNs. In each one of them, the hyperexponential service center is replaced by an exponential service center with average service time SS in one case and SL in the other. These two QNs are product form QNs and can be solved by the methods discussed previously in the book. Based directly on the theory of near-complete decomposability [14], the performance metrics of the original network (i.e., the one with the hyperexponential service center) can be obtained as the weighted averages of the performance metrics of the two product-form QNs. The weights are the probabilities pS and pL. The decomposition approach captures well the behavior of models with high service time variability. This technique yields results within 15% of the exact values over the large region of the parameter space [18]. A disadvantage of this method is its complexity for solving models that contain many centers with high service time variability. Figure 15.3. Model of a QN with a two-stage hyperexponential service center. 15.2.2 New MVA-based Decomposition ApproachInstead of decomposing the model into two independent QN models, the approach described in this section applies the decomposition principle only to each individual service center with high service time variability [14]. This is done by modifying the MVA equations for these service centers only and keeping the regular MVA equations for the other service centers. Let G be a service center with high service time variability and let DS and DL be the service demands at G considering the short and long service times discussed earlier. Then, the residence time at G can be written as Equation 15.2.6 where pL and pS are as before and Equation 15.2.7 Equation 15.2.8 Equation 15.2.9 Equation 15.2.10 Eqs. (15.2.7) and (15.2.8) are the well-known MVA residence time equations with the difference that they use the proper service demand (long or short) and the proper expressions for queue length given in Eqs. (15.2.9) and (15.2.10). The queue length equations for nL(N) and nS(N) follow the well-known MVA queue length equations with the difference that, in each case, the throughput (i.e., N divided by the response time) includes the short or long residence time plus the residence time, Rrest(N), in the rest of the QN. Example 15.1.Consider a mail server with a powerful processor and one large disk subsystem. The analyst wants to model the system to analyze the future performance of the server under different workload scenarios. When choosing the abstraction to model the mail server, it was decided to use a closed QN model because during peak times the mail server has a constant (i.e., maximum) number of processes handling incoming and outgoing messages. A study of mail server workloads [9] shows that message size statistics exhibit a large coefficient of variation. Assuming the processor time to process a message is proportional to the size of the message, it is necessary to include high service time variability at the processor in the model. Assume that the following input parameters were obtained through measurements: CVp = 4, N = 200, Dp = 0.0060 sec, and Dd = 0.0071 sec, where "p" and "d" stand for processor and disk, respectively. The question is: what are the throughput and response time of the mail server? Consider two solution techniques. The first ignores the high variability for the service time at the processor and the other uses the modeling approach described earlier.
|

EAN: 2147483647
Pages: 166