11.6 MG1 with Priorities
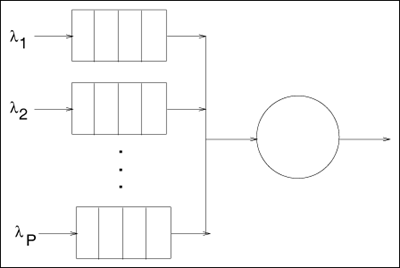
11.6 M/G/1 with PrioritiesMany computer systems (e.g., operating systems and communication systems) assign different priorities to the incoming requests. Figure 11.3 illustrates a situation with different waiting lines and one server. The different waiting lines are used by requests of different priorities. The priority of an arriving customer determines which priority waiting line is entered. Thus, customers are classified into P different static priorities before arriving into the system. Upon arrival, customers join the waiting line that corresponds to their priority class. Priority classes are numbered from 1 to P with P being the highest priority class and 1 being the lowest. The arrival rate of requests of priority p (p = 1, ···, P) is denoted by lp. The average service time and second moment of class p requests are denoted by E[Sp] and Figure 11.3. A single server system with priority classes. The server processes the customer of highest priority according to either a non-preemptive strategy or with a preemptive resume strategy [3]:
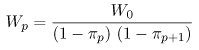
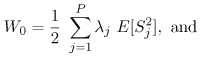
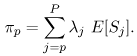
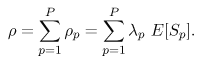
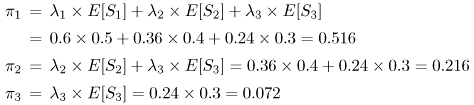
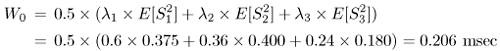
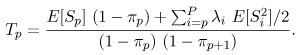
11.6.1 Non-Preemptive PrioritiesThe waiting time Wp of requests of priority p (p = 1, ···, P) is computed as [3]: Equation 11.6.20 where Equation 11.6.21 Equation 11.6.22 W0 represents the average time an arriving request has to wait for the server to complete processing the current request in service. The product lj E[Sj] is the utilization rj due to priority j requests. The total utilization r is then Equation 11.6.23 The average response time of priority class p requests is Tp = Wp + E[Sp]. Example 11.6.A router receives packets at a rate of 1.2 packets/msec from a Poisson process. All packets are transmitted through the same outgoing link. Assume that 50% percent of the packets are of priority 1, 30% percent are of priority 2, and 20% percent are of priority 3. Assume that the mean and second moment of the packet transmission times are as shown in Table 11.2. What is the average waiting time per packet class?
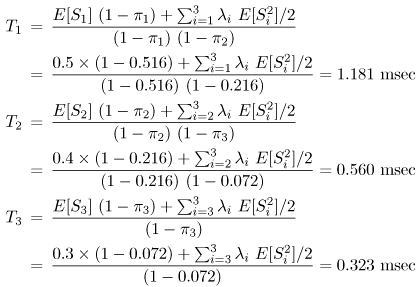
The arrival rates per class are: l1 = 1.2 x 0.50 = 0.6 packets/msec, l2 = 1.2 x 0.3 = 0.36 packets/msec, and l3 = 1.2 x 0.2 = 0.24 packets/msec. Then, from Eq. (11.6.22): From Eq. (11.6.21): Finally, from Eq. (11.6.20): The average response times for each priority class are T1 =W1 + E[S1] = 0.543 + 0.5 = 1.043 msec, T2 = W2 +E[S2]2 = 0.283 + 0.4 = 0.683 msec, and T3 = W3 + E[S3] = 0.222 + 0.3 = 0.522 msec. 11.6.2 Preemptive Resume PrioritiesThe average response time Tp in this case is given by [3]: Equation 11.6.24 Note that classes of priority lower than p are not represented in Eq. (11.6.24) because of preemption. That is, because of preemptions, requests of a lower priority have no impact on higher priority requests. Example 11.7.Assume the same data of the previous example and assume a preemptive resume server. What are the average response times of each customer class? Equation (11.6.24) yields, Note that class 3 receives improved response time in the preemptive case than in the non-preemptive case (i.e., 0.323 vs. 0.522 msec of response time). This is due to the fact that class 3 is not affected by classes 1 and 2. Class 1 receives degraded performance in the preemptive case (i.e., 1.181 vs. 1.043 msec of response time) since it only uses the server when there are no requests of classes 2 and 3 present in the system. The behavior of class 2 depends on the specific parameters of the problem. In the preemptive case, class 2 requests do not have to wait for class 1 requests to complete service but can be preempted by class 3 requests. |

EAN: 2147483647
Pages: 166