1.15 Clustering Burglars: A Case Study
1.15 Clustering Burglars: A Case Study
The following case study is presented in its original format. The author would like to thank Inspector Rick Adderley for contributing the paper, which demonstrates how the use of a Kohonen neural network, or self-organizing map (SOM), was used to link crimes to perpetrators. This type of neural network is used to discover clusters in data sets.
Data Mining at the West Midlands Police: A Study of Bogus Official Burglaries
Richard Adderley West Midlands Police, Bournville Lane Police Station e-mail: r.adderley@west-midlan.ds.police.uk P. B. Musgrove School of Computing and Information Technology, University of Wolverhampton e-mail: P.B.Musgrove@wlv.ac.uk
Abstract
Bogus official burglaries refer to crimes where a person(s) gains access to a premises by deception with the intention of stealing property. Experience has shown that such offenders tend to commit several similar crimes. The offender(s) may also be active across a wide geographical region covered by different police areas. That, together with the sheer volume of such crimes, makes it very difficult for the police to link crimes together in order to form composite descriptions of offender(s) and identify patterns in their activities.
This paper describes the results of applying a Kohonen self-organizing map (SOM) to a set of data derived from reported bogus official crimes with the objective of linking crimes committed by the same offender. The issues involved with how crime data is selected, cleaned, and coded are also discussed.
The results were independently validated and show that the SOM has found some links that warrant follow-up investigations. Some problems with data quality were experienced. Their effect on the map produced by the SOM algorithm is also discussed.
1.15.1 Introduction
Today computers are pervasive in all areas of business activity. This enables the recording of all business transactions, making it possible not only to deal with record keeping and control information for management, but also, via the analysis of those transactions, to improve business performance. This has led to the development of the area of computing known as data mining [1].
The police force, like any other business, now relies heavily on the use of computers. In the police force, business transactions consist of the reporting of crimes. A great deal of use is made of computers for providing management information via monitoring statistics that can be used for resource allocation. The information stored has also been used for tackling major serious crimes (usually crimes such as serial murder or rape), the primary techniques used being specialized database management systems and data visualization [2]. However, comparatively little use has been made of stored information for the detection of volume crimes, such as burglary. This is partly because major crimes can justify greater resources on the grounds of public safety but also because there are relatively few major crimes, making it easier to establish links between offenses. With volume crimes, the sheer number of offenses, the paucity of information, the limited resources available, and the high degree of similarity between crimes render major crime techniques ineffective.
There have been a number of academic projects that have attempted to apply AI techniques, primarily expert systems, to detecting volume crimes, such as burglary [3,4]. While usually proving effective as prototypes for the specific problem being addressed, they have not made the transfer into practical working systems. This is because they have been stand-alone systems that do not integrate easily into existing police systems, thereby leading to high running costs. They tended to use a particular expert's line of reasoning, with which the detective using the system might disagree. Also they lacked robustness and could not adapt to changing environments. All this has led to wariness within the police force regarding the efficacy of AI techniques for policing.
The objective of the current research project is therefore to evaluate the merit of data mining techniques for crime analysis. The commercial data mining package Clementine (SPSS) is being used in order to speed development and facilitate experimentation. Clementine also has the capability of interfacing with existing police computer systems. The requirement for purpose-written software outside the Clementine environment is being kept to a minimum.
In this paper we report the results from applying one specific data mining technique, the self-organizing map (SOM) [5] to descriptions of offenders for a particular type of crime, bogus official burglaries. The stages of data selection, coding, and cleaning are described together with the interpretation of the meaning of the resulting map. The merit of the map was independently validated by a Police Officer who was not part of the research team.
1.15.2 The Application Task
The specific application task reported here consists of a particular type of burglary. A bogus officials offense (sometimes known as a distraction burglary) refers to a burglary where the offender gains access to a premises by deception. The offender(s) may pose as a member(s) of the utilities, police, social services, salespersons, even children who are looking for pets or toys, to gain entry to the property. Typically, once inside, the victim is engaged in conversation while an accomplice searches for and steals property. In this type of burglary, the victim always meets the offender(s) and, therefore, should be able to provide a description.
A problem with this type of crime is that the sheer number of offenses committed over a wide geographical area makes it difficult to link crimes committed by the same offender(s). The objective in this study is to see whether a SOM can be used to link crimes based on offender descriptions. This will result in a map (more accurately a matrix) where each cell represents a cluster of offender descriptions. The ideal solution would be a SOM where each cell contains various descriptions of all the crimes involving a single offender. Neighboring cells in the map would contain descriptions of different offenders who bear a physical resemblance.
The ideal solution will always be unattainable due to the same offender being described differently by victims of different crimes. In addition, the high degree of similarity between some offenders (e.g., young, average build, average height) will inevitably mean the same cell will contain descriptions of different offenders. Just how far the map derived in practice differs from the ideal would help determine the efficacy of the technique. Unfortunately, few of the crimes have been successfully detected (i.e., solved) and, hence, there is no perfect solution to act as a comparison.
Consequently, a subjective assessment of the merit of the resulting map needs to be made. This subjective assessment can be supported/influenced by information from those crimes that have been detected.
1.15.3 Data Selection, Cleaning, and Coding
The victims of this type of crime tend to be elderly. Their age, together with the distressed state brought on by the crime, might be thought to lead to unreliable descriptions being provided. However, a recent study commissioned by the Metropolitan Police concluded, "There is no evidence that their attention, language, recognition, recency judgements or memory for the past is affected by age" [6]. The study included an experiment on older persons that indicated that the offender characteristics most likely to be accurately recalled are (in the order of most common to least frequently mentioned) gender, accent, race, age, general facial appearance, build, voice, shoes, eyes, clothes, and hair color and length.
When a bogus official crime is reported, a police officer attends the scene and takes a number of witness statements, and then completes a paper-based report called the crime report, which includes information abstracted from the witness statements. The crime reports are then summarized by civilian data entry clerks when they enter the details of the crime into the computerized database system. The crime record contains numerous fields. Fixed fields contain names, addresses, beat number, and other administrative data. In addition, there are two free-text fields: The first contains a description of the offender(s). The second describes how the crime was committed (the modus operandi, or MO).
While providing valuable information, the free-text nature of these fields makes automated analysis difficult. Consequently, it was necessary to write a simple parser program to pick out key words and phrases. This proved more difficult than expected due to the widely varying styles used by police officers and data entry clerks. Spelling mistakes were common, abbreviations were inconsistent, and word sequencing varied (for example, accent might be described as "Birmingham acent," "Birmingham accent," "Bham accent," "local accent," "accent: Birmingham," or even "not local accent"). As a consequence, the coding was part automatic and part manual.
Once key words had been abstracted from the description field, they showed some agreement with that found by Barber [6] with the exception of shoes and eyes, which were rarely mentioned. Because of the diversity of possible clothing and the likelihood of it changing between crimes, it was decided to omit this from the coded descriptions. This provided fields for age, gender, height, hair color, hair length, build, accent, and race. Fields not mentioned by Barber but included in this study are the person's height and the number of accomplices.
Care needs to be taken when encoding data from its symbolic form to the numeric form required by the SOM. Data could be a number on a continuous scale (such as age), binary (such as gender), nominal (such as hair color), and ordinal (such as hair length, which can be ordered as short, medium, or long). Nominal and ordinal variables can each be represented by a set of binary variables, although some information could be lost (i.e., order information) [7]. A further problem when dealing with continuous variables can arise due to certain variables swamping the effect of others due to their range being greater. It is common to standardize variables, but this can in itself cause problems, particularly for unsupervised techniques (such as SOM). This is due to the discriminating effect of the variable being lost. For example, in scaling age, which might range from 15 to 65, into a range of 0 to 1 would lead to a 20 year-old being scaled as 0.1 and a 30 year old 0.3. Thus, a difference of 10 years in age (a value of 0.2) would be 10 times less important compared to a difference in an attribute, such as build, which is coded as a strict 0 or 1 (NB: a difference in build would score two, one for each difference). For example, if offender A was described as being aged about 30 with medium build and offender B as being aged about 30 but with small build, there would be a difference of 2 between the descriptions. However, if offender A was described as having a medium build and being aged about 20 (scaled to 0.1) and offender B was described as having a medium build but being aged about 30 (scaled to 0.3) the difference would be 0.2. Due to these problems, it was decided to code the continuous age and height variables using a binary encoding, thereby placing them on a similar level of importance as the other binary variables.
The continuous age and height attributes were each expressed as ranges split into a number of intervals. If the height given in the description lay within a specified range, it was coded as a one and the other intervals as zero. In order to allow for slight discrepancies between descriptions of the same offender and to incorporate some aspect of ordering, two sets of overlapping intervals were used for each variable. This means that each height was encoded as a set of binary variables, two of which would be set to 1 for any given height and the remainder set to 0, and similarly for age.
To illustrate, consider an offender who is estimated as being about 5'5" (people still do not think in metric units). This would be encoded as a 1 for the interval 5'2" to 5'6" (e.g. H11=0 H12=1 and H13=0) and also a one for the interval 5'4" to 5'8" (i.e. H21=0 H22=1, H23=0 and H24=0) (Figure 1.7). This incorporates a degree of fuzziness in the description of age and height. However, it is at the cost of effectively giving age and height a double count when it comes to comparing similarities between descriptions.
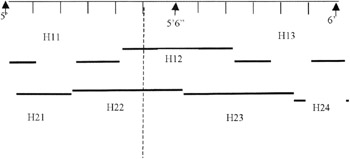
Figure 1.7: Illustrative example of the encoding of height as zero or one.
A further problem encountered in producing comparable descriptions is that of missing attributes. Sometimes attributes such as build are not recorded. This means in our system of encoding that all build binary variables will be set to 0. This does not mean that the person does not have a build! The problem of missing values is notorious in statistical data analysis. There is no universal solution for dealing with this problem adequately. What is of interest is how robust the technique is, faced with the inevitable missing values.
Over the three-year period under consideration, there were 800 bogus official crimes involving 1,292 offenders in the police areas under consideration. Dealing with all 800 would generate a solution that was intractable regarding analysis and validation. Consequently, it was decided to deal with a subset of the crimes. Those crimes involving female offenders were selected as they represented a reasonable time cross-section and consisted of just 105 offender descriptions associated with 89 crimes. The SOM algorithm was provided with records consisting of offender descriptions. There could be more than one description associated with a particular crime (i.e., in crimes where more than one female is involved). Each of these descriptions was represented by up to eight attributes: race, age, height, number of accomplices, build, hair color, hair length, and accent. When translated into a binary encoding, this resulted in 46 binary variables out of which at most 10 would be given a value of 1 (each height and age being represented by two binary variables). In practice, due to incomplete descriptions, the number of binary variables per description taking a value of 1 varied between 3 and 9 with an average of 7.5.
1.15.4 Application Construction
The SOM [5] is an unsupervised neural network training method. It takes data consisting of a number of unordered records (in this task the 105 offender descriptions), each of which is measured by a variety of attribute values (in this task 46 binary variables). It iteratively organizes the input records by grouping them into clusters. The clusters are themselves ordered into a two-dimensional spatial configuration where the members of one cluster bear a resemblance to neighboring clusters, but not as strong a resemblance as they do to members of their own. The SOM can be viewed as a dimension-reduction visualization technique, in this case reducing from 46-dimensional space to two dimensions. The resulting two-dimensional configuration is a topological, rather than spatial map, (i.e., it is like a London underground map, rather than a road map). The implementation of the SOM algorithm used was that provided by the Clementine data mining package.
A design consideration when constructing a SOM is to decide on the dimensions of the resulting grid. Too many cells would see various descriptions of the same offender being split across a number of cells each with a highly specialized description. Too few cells would see cells formed containing a large number of different offenders potentially with a high degree of variability between descriptions. It was decided to construct a five-row-by-seven-column map. This allows for a potential of 35 different offenders each committing three crimes. If there were more than 35 offenders, it would force offenders with similar descriptions to be clustered together. If there are fewer than 35 offenders the SOM algorithm could place descriptions of the same offender across a number of cells. The SOM algorithm is free to put as many descriptions as it likes in a cell (i.e., more or less than three) depending upon how similar they are to each other.
1.15.5 Findings
The results produced by using the SOM option of Clementine can be seen in Figure 1.8. The cells in the table show the number of offenders placed in the cluster associated with the cell. The blacked-out cells indicate empty clusters. Their presence in the SOM tends to indicate large spatial differences between clusters on opposite sides.
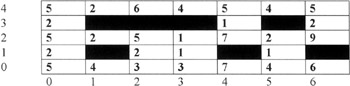
Figure 1.8: Derived cluster sizes.
In order to interpret this map, a symbolic description of each cluster was derived by finding the average value for each attribute in a cluster. Provided the average value was greater than 0.5, then that binary variable name was assigned as the cluster's attribute value. This interpretation of the SOM can be seen in Figure 1.9. Blank fields are due either to great variability in the values of the attribute or the absence of a description for that attribute in the crime report for the majority of cluster members.
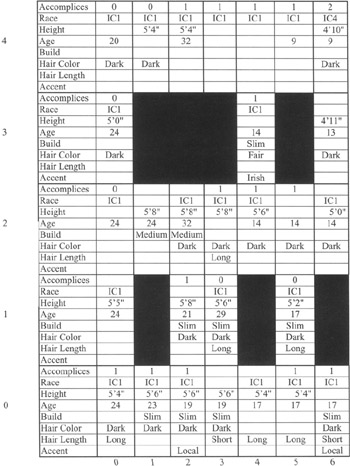
Figure 1.9: Symbolic descriptions of clusters.
1.15.6 Validation Process
The SOM-labeled map, together with the crime numbers apertaining to each description in a SOM cell, were passed to a police sergeant who was not part of the research team for independent verification. The sergeant had access to more information than had been made available to the SOM algorithm. This included full witness statements (often more than one for each crime), information on the modus operandi (MO), and information as to which crimes had been solved. Time permitted the sergeant to analyse 17 of the 24 nonempty clusters. The sergeant was given the brief to decide if there was sufficient evidence in the witness statements and for those crimes that had been solved to say whether there was a possible link between some of the crimes in each cluster. Clusters were analyzed individually with no attempt to look for links between neighboring clusters.
Of the 17 clusters analyzed, one contained insufficient details to make a judgement; five had no apparent links between offenders in them.
The remaining 11, in the judgement of the sergeant, contained subsets of offender descriptions that could be linked based on the extra sources of information.
An example of a description provided by the sergeant is cluster (6,0).
6 crimes; 3 with 1 male and 1 female, 2 with 2 female and 1 with 1 female and 2 males. One crime was detected to Mr. X. The female ages range from 13 yrs to 25 yrs across the cluster, only one not being described as slim/thin. The heights range from 5'2" to 5'5." Short hair. In three crimes the MO was very similar in that social services and food parcel were mentioned, but this did not occur for the detected crime
The independent evidence provided by the social services MO provides suggestive evidence for linking three of the six crimes. The descriptions for these three crimes could be consolidated to form a composite picture of the female offender.
These results are encouraging, as links between crimes have been established that had not been previously made. However, the sergeant mentioned two negative aspects that need addressing. First, many of the cells analyzed contained members that were in his opinion clearly different from the majority of members of the cell. Second, some of the solved crimes pertained to offenders appearing in widely differing cells on the map. He suggested one possible cause being the wide variance in descriptions of the same offender (in those case where a definite link can be made, this is contrary to Barber's findings). To illustrate, he provided the following example again for cluster (6,0):
2 crimes in this cluster were committed next door to each other 3 1/2 hours apart on the same day. The same MO was used, and 1 male and 1 female were the offenders. In the first crime the offenders were described as female, IC1, 18 yrs, local accent, 5'5" thin build with blond bobbed hair; male IC1, 25 yrs, 6' thin build with short ginger hair. In the other crime the offenders were described as female, IC1, 20 - 25 yrs, 5'2", slim build with short dark hair; male, IC1, 25 - 30 yrs, 5'8", robust build with fair hair. In the case papers, the officer who attended the scene commented that the victim, in the second crime, was confused and forgetful and could not be regarded as a reliable witness.
1.15.7 Discussion and Further Work
While generally encouraging, the validation process indicated a number of areas where there is room for improvement. One would be to consider removing descriptions from the analysis where there are a number of incomplete values. This was the main contributor to the clusters where the sergeant could not find any links. This does not mean these crimes would be ignored. Once the SOM is derived from the more complete descriptions, the less complete descriptions can be matched against the stereotype description for each cell and then ranked in terms of the goodness of the match. Possibly, these vague descriptions could be considered as "secondary" members of more than one cell.
Another possible improvement is to merge some of the neighboring clusters to make allowance for slight variations in descriptions. The five-row-by-seven-column SOM was an arbitrary selection. Possibly it is too big. One way of merging clusters suggested in [8] is to use the vector of average values representing each cluster and apply hierarchical agglomerative clustering [7]. This basically means sequentially merging clusters based on their distance apart (distance can be measured in many ways; here we used the standard squared Euclidean distance), recalculating the new cluster average, and then merge the next two nearest. The agglomerative clustering was performed using the SPSS statistical package. The results are displayed in the dendrogram in Figure 1.10. (A dendrogram is a graphical way of showing the hierarchical merging process.)
C = column R = Row C R 3 4 -+-------+ 4 4 -+ +-------+ 2 4 -------------+ +---+ 0 2 -----------------+ +---+ 0 4 ---------------------+ +-----+ 1 4 -------------------------+ +-------+ 0 3 -------------------------------+ I 4 0 ---+---------+ +---+ 5 0 ---+ +-----------+ I I 6 0 -------------+ +-------------+ +---+ 5 l -------------------------+ I I 3 1 -------------------------------------------+ +-+ 5 4 -------------------+---------------+ I I 6 4 -------------------+ I I I 6 2 -------+---+ +-----------+ I 6 3 -------+ +---+ I I 5 2 -----------+ +-------+ I I 4 2 ---------------+ +-----------+ I 4 3 -----------------------+ I 1 2 ---------------------+-------+ I 2 2 ---------------------+ +---------+ I 3 2 -----------------------------+ I I 0 0 -------+-----+ +---------+ 1 0 -------+ +-------------+ I 0 1 -------------+ +-----+ I 2 0 ---------------+-----------+ +-----+ 3 0 ---------------+ I 2 1 ---------------------------------+
Figure 1.10: Dendrogram for hierarchical agglomerative clustering of SOM cluster centres.
This dendrogram shows that cluster (3,4) should be the first to be merged with (4,4). As these both had the same symbolic description in Figure 1.9, this is no surprise. The next two clusters to be merged would be (4,0) and (5,0). This process could be continued indefinitely until there is only one cluster. Ripley [7] suggests stopping the merging process when a merging is suggested between two clusters that are not contiguous on the map. This occurs when (0,2) is suggested as being merged with the (2,4), (3,4), and (4,4) supercluster.
The effect of applying hierarchical clustering on the SOM can be seen in Figure 1.11.

Figure 1.11: SOM map following merging of spatially near neighbors.
Merging to avoid missing possible links with neighbors will undoubtedly mean merging some unrelated crime descriptions together. However, the numbers are still at a tractable level for manual analysis. Also, it is possible to apply a splitting criteria (e.g., race) to members of the specific supercluster. Different superclusters might use different splitting criteria.
The above merging will address some of the problems where descriptions vary slightly; however, for more radical variations, it will not help. These are best addressed outside the context of software tools. If an indication of the reliability of the witness statement could be obtained, then only reliable data could be used. Also some variability is due to the time span. The data used in this study covered a three-year period. During that time, the appearance of one particular teenage offender, who was convicted for a number of the crimes, changed radically. When dealing with larger collections of data (e.g., male offenders), crimes committed within a smaller time window should be used.
A valuable source of information not included in this study is the modus operandi (MO). The diversity of MOs, together with the variety of ways of describing them, precluded their use within the time scales and budget of the current study. However, this information was utilized for validation purposes by an independent police officer.
The loss of this information initially appears restrictive, but it does lend extra generality to results obtained as they would be applicable to descriptions for crimes other than bogus official burglaries. An illustration of the type of information available, but omitted, can be seen in Table 1.1.
| MO Field |
|---|
| PERSON UNKNOWN POSING AS COUNCIL WATERBOARD WORKER GAINED ENTRY TO PREMISES. KEPT IP ENGAGED IN KITCHEN WHILE SECOND MALE ENTERED PREMISES AND MADE SEARCH OF FLAT AND STOLE PROPERTY (2ND PERSON NOT SEEN IN PREMISES), BOGUS WORKER MADE EXCUSES AND LEFT PREMISES. |
| OFFENDER ATTENDED PREMISES. SHOWED "HOUSING DEPARTMENT" ID CARD WITH PHOTO ON IT AND SAID HE NEED TO CHECK THE WATER. OFFENDER WAS ALLOWED IN BY ELDERLY IP, WHO WAS THEN TOLD TO RUN THE KITCHEN TAPS. OFFENDER STAYED FOR A FEW MINUTES BEFORE LEAVING DURING WHICH TIME HE WAS ALLOWED ACCESS TO ALL ROOMS UNACCOMPANIED. AFTER OFFENDER HAD LEFT PREMISES, IP DISCOVERED PROPERTY MISSING. |
A further use of the SOM could be to link crimes based on pairing offenders. For example, if a crime was committed by two offenders and the description of one offender is in, say, cell (0,0) and the description of the other offender is in cell (4,4), then look for other crimes committed by pairs belonging to these two cells or their near neighbors. This will be the subject of further investigation.
1.15.8 Conclusions
We have described how the SOM algorithm can be used to cluster offender descriptions for a particular type of crime, the bogus official burglary. Independent validation has shown that interesting links have been found within clustered descriptions. Some problems have been identified and solutions suggested. Some of these problems are to do with the data and the need for cleaner fuller descriptions being selected before being used by the SOM algorithm. Others are to do with modifying the final map in order to facilitate the search for links with descriptions belonging to neighboring clusters.
References
1. Adriaans, P. and Zantinge, D. Data Mining, Addison-Wesley, 1996.
2. Adderley, R. and Musgrove, P.B., General Review of Police Crime Recording and Investigation Systems, Submitted to Policing: An International Journal of Police Strategies and Management.
3. R. Lucas, "An Expert System To Detect Burglars Using a Logic Language and a Relational Database," Fifth British National Conference on Databases, Canterbury U.K., 1986.
4. Charles, J., "AI and Law Enforcement", IEEE Intelligent Systems Jan/Feb 1998 pp. 77–80.
5. Kohonen, T., "The Self-Organizing Map," Proceedings of the IEEE, Vol. 78, No. 9, 1990, pp. 1464–1480.
6. Baber M. and Brough P., "Identification Evidence of Elderly Victims and Witnesses," Police Research Group, Home Office: 1997.
7. Gordon, A.D., Classification, Chapman and Hall, 1981.
8. Ripley, B.D., Pattern Recognition and Neural Networks, Cambridge, U.K.: Cambridge University Press, 1996.
EAN: 2147483647
Pages: 232
- Structures, Processes and Relational Mechanisms for IT Governance
- An Emerging Strategy for E-Business IT Governance
- A View on Knowledge Management: Utilizing a Balanced Scorecard Methodology for Analyzing Knowledge Metrics
- Technical Issues Related to IT Governance Tactics: Product Metrics, Measurements and Process Control
- Governing Information Technology Through COBIT