Chapter 15: Viewing and Reporting Project Status
![]() Download CD Content
Download CD Content
In this chapter you will learn to:
-
Determine which tasks were started or completed late.
-
View task costs at summary and detail levels.
-
Examine resource costs and variance.
-
Use custom fields to create a stoplight view that illustrates each task’s cost variance.
| See Also | Do you need a quick refresher on the topics in this chapter? See the quick reference entries on pages xxxv–xxxvi. |
After a project’s baseline has been set and work has begun, the primary focus of the project manager shifts from planning to collecting, entering, and analyzing project performance details in Microsoft Office Project 2003. For most projects, these performance details boil down to three primary questions or vital signs:
-
How much work was required to complete a task?
-
Did the task start and finish on time?
-
What was the cost of completing the task?
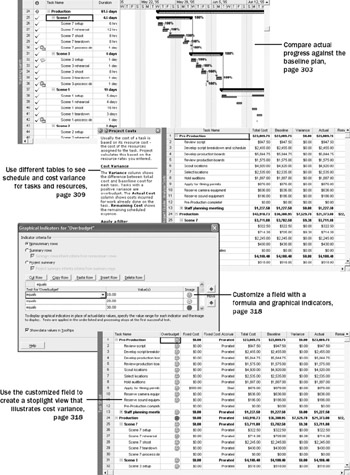
Comparing the answers to these questions against the baseline gives the project manager and other stakeholders a good way to measure the project’s progress and to know when corrective action might be necessary.
Communicating project status to key stakeholders such as customers and sponsors is arguably the most important function of a project manager, and one that might occupy much of your working time. Although perfect flow of communication can’t guarantee a project’s success, a project with poor communications flow is almost guaranteed to fail.
A key to properly communicating project status is knowing the following:
-
Who needs to know the project’s status and for what purpose?
-
What format or level of detail do these people need?
The time to answer these questions is in the initial planning phase of the project. After work on the project is under way, your main communications task will be reporting project status. This can take several forms:
-
Status reports that describe where the project is in terms of cost, scope, and schedule (these are the three sides of the project triangle)
-
Progress reports that document the specific accomplishments of the project team
-
Forecasts that predict future project performance
Where the scheduled or actual project performance differs from the baseline plan, you have variance. Variance is usually measured as time, such as days behind schedule, or as cost, such as dollars over budget. After initial project planning is complete, many project managers spend most of their time identifying, justifying, and, in many cases, responding to variance. However, before you can respond to variance, you must first identify, document, and report it. That is the subject of this chapter.
| Tip | This tip describes enterprise project management (EPM) functionality. This chapter describes reporting project status to stakeholders. Project Professional, when used with Project Server, provides much more sophisticated ways of not only publishing project status online, but collecting information (such as actual work) from resources and other stakeholders as well. To learn more about the enterprise collaboration tools available with Project Server, see Part 4, “Introducing Project Server.” |
| Important | On the CD Before you can use the practice files in this chapter, be sure you install them from the book’s companion CD to their default location. See “Using the Book’s CD-ROM,” on page xiii, for more information. |
Identifying Tasks That Have Slipped
One cause of variance is delays in starting or finishing tasks. You’d certainly want to know about tasks that started late or future tasks that might not start as scheduled. It’s also helpful to identify completed tasks that did not start on time and to try to determine why.
There are different ways to see delayed tasks, depending on the type of information you want:
-
Apply the Tracking Gantt view to graphically compare tasks’ baseline dates with their actual or scheduled dates.
-
Apply the Variance table to a task view to see the number of days of variance for each task’s start and finish dates.
-
Filter for delayed or slipping tasks with the Slipped/Late Progress or Slipping Tasks filters.
-
Follow the instructions in the Check Progress pane (select Check the progress of the project under Track in the Project Guide) or in the Compare Progress pane (select Compare progress against baseline work under Reports in the Project Guide).
In this exercise, you apply some of these and other methods to identify variance.
| Important | If you are running Project Professional, you may need to make a one-time adjustment to use the My Computer account and to work offline. This helps ensure that the practice files you work with in this chapter don’t affect your Project Server data. For more information, see “Starting Project Professional,” on page 10. |
OPEN: Short Film Project 15a from the \My Documents\Microsoft Press\Project 2003 Step by Step\ Chapter 15 Reporting Status folder. You can also access the practice files for this book by clicking Start, All Programs, Microsoft Press, Project 2003 Step by Step, and then selecting the chapter folder of the file you want to open.
-
On the File menu, click Save As.
The Save As dialog box appears.
-
In the File name box, type Short Film Project 15, and then click the Save button.
To begin your analysis of tasks that have slipped, you’ll start at the highest level— the project summary information.
-
On the Project menu, click Project Information.
The Project Information dialog box appears.
-
Click the Statistics button.
The Project Statistics dialog box appears.
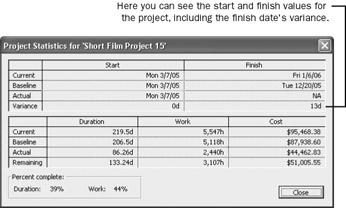
In this dialog box you can see, among other things, that the project currently has 13 days of schedule variance on the finish date. In effect, the overall project finish date has slipped out this number of days.
-
Click the Close button to close the Project Statistics dialog box.
For the remainder of this exercise, you will use various techniques to examine the specific task variance.
-
On the View menu, click Tracking Gantt.
Project displays the Tracking Gantt view.
-
In the Task Name column, click the name of task 25, the Scene 7 summary task, and scroll the Tracking Gantt view up so that task 25 appears near the top of the view.
-
On the Standard toolbar, click the Go To Selected Task button.
In the chart portion of this view, the tasks as they are currently scheduled appear as blue bars (if they are not critical tasks) or red bars (if they are critical). In the lower half of each task’s row, the baseline values of each task appear as gray bars.
Your screen should look similar to the following illustration:
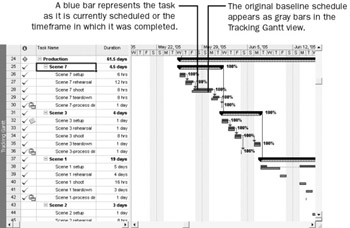
Here you can see where tasks began to vary from their baselines. Tasks 26 and 27 started as planned, but task 27 finished later than planned.
-
On the Edit menu, click Go To.
The Go To dialog box appears.
Tip Remember that [Ctrl] + [G] is a keyboard shortcut for displaying the Go To dialog box.
-
In the ID box, type 41, and click OK.
Project scrolls the Tracking Gantt view to display task 41 and its adjacent tasks.
-
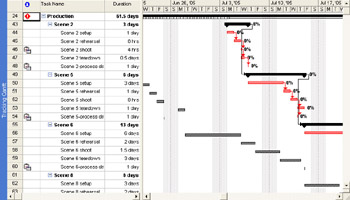
Scroll the Tracking Gantt view up so that task 41 appears near the top of the view.
Your screen should look similar to the following illustration:
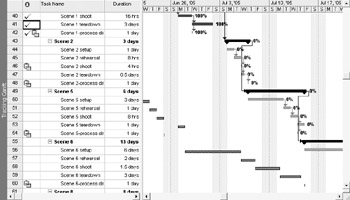
Here, you can see baseline task bars (the patterned gray bars), completed task bars (the solid blue bars), and bars for tasks scheduled but not yet not started (the red bars).
Tip To see details about any bar or other item in a Gantt Chart view, position the mouse pointer over it. After a moment, a ScreenTip appears with details.
To focus in on just the slipping tasks, you will apply a filter.
-
On the Project menu, point to Filtered For: All Tasks, and then click More Filters.
The More Filters dialog box appears. In it, you can see all the predefined filters for tasks (when in a task view) and resources (when in a resource view) available to you.
-
In the More Filters box, click Slipping Tasks, and then click the Apply button.
Project filters the task list to show only those tasks that, as they are now scheduled, have slipped from their baseline plan. Your screen should look similar to the following illustration:
Note the gaps in the task ID numbers. Tasks 1 through 23, for example, do not appear with the filter applied, because they are already complete.
At this point in the schedule, the scheduled start date of tasks has slipped quite a bit. (To visually verify how much these tasks have slipped, you can scroll the chart portion of the Tracking Gantt view to the left to see the baseline Gantt bars for each task.) These tasks’ scheduled Gantt bars are formatted red to indicate that they are critical, meaning that any delay in completing these tasks will delay the project’s finish date.
-
On the Project menu, point to Filtered For: Slipping Tasks, and then click All Tasks.
Project removes the filter. As always, displaying or removing a filter has no effect on the original data.
The Tracking Gantt view graphically illustrates the difference between scheduled, actual, and baseline project performance. To see this information in a table format, you will display the Variance table in the Task Sheet view.
-
On the View menu, click More Views.
The More Views dialog box appears.
-
In the Views list, click Task Sheet, and then click the Apply button.
Project displays the Task Sheet view. Next you’ll switch to the Variance table.
-
On the View menu, point to Table: Entry, and then click Variance.
Tip You also can right-click the Select All button in the upper left corner of the active table to switch to a different table.
The Variance table appears in the Task Sheet view. Your screen should look similar to the following illustration:
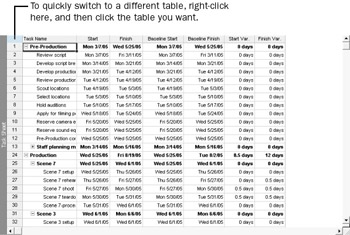
In this table you can see the scheduled, baseline, and variance values per task.
Here are a few more tips and suggestions for viewing slipped tasks:
-
To see a legend of all Gantt bar color coding and symbols, switch to a Gantt Chart view and on the Format menu, click Bar Styles, and in the Bar Styles dialog box, look at the Name and Appearance columns.
-
All filters are available to you via the Filter button on the Formatting toolbar. The name of the active filter appears in this button; click the arrow next to the filter name to see other filters. If no filter is applied to the current view, All Tasks or All Resources appears on the button, depending on the type of view currently displayed.
-
You can see the criteria that most filters use to determine which tasks or resources they will display or hide. On the Project menu, point to Filter For: All Tasks, and then click More Filters. In the More Filters dialog box, click a filter and click the Edit button. In the Filter Definition dialog box, you can see the tests applied to various fields for the filter.
-
The Slipping Tasks report describes tasks that are off-schedule. On the View menu, click Reports. In the Reports dialog box, double-click Current Activities, and then double-click Slipping Tasks.
-
In this exercise you have viewed variance for a task. To see variance for assignments to a task, switch to the Task Usage view, and then apply the Variance table (to see scheduled variance) or the Work table (to see work variance).
If you work in an organization that is highly focused on projects and project management, chances are that standard methods and formats already exist within your organization for reporting project status. If not, you might be able to introduce project status formats that are based on clear communication and project management principles.
Techniques you can use in Project to help you report project status include the following:
-
Printing the Project Summary report.
-
Copying Project data to other applications—for example, use the Copy Picture To Office Wizard (Analysis toolbar) to copy the Gantt Chart view to Word or to PowerPoint.
-
Saving Project data in other formats, such as HTML, using the Compare To Baseline export map.
-
For Project Professional users, sharing project status through Project Server, which enables the stakeholders you choose to view project details through their Web browsers.
All these status-reporting tools are described elsewhere in this book.
EAN: 2147483647
Pages: 199